- https://sysadmindemo.com/
- Simple Deployment Pipeline | Github
- Setting service account permissions
- Building, testing, and deploying artifacts
- Cloud builders
- 8 surprising facts about real Docker adoption | Datadog
In this episode, we are going to set up a very simple end-to-end automated container deployment pipeline. We will walk through going from a “git push”, to a change deployed in production with zero downtime, in just under a minute. This is commonly referred to as Continuous Integration and Continuous Delivery, or just CI/CD for short.
Before we dive in. I wanted to mention, that I am approaching this episode as if you are totally new to the concept of CI/CD and automated container deployments. So, if you are a CI/CD expert, this will likely be nothing new to you. The intention here, is to show off some cool stuff, and lay down foundational knowledge that we can build on later.
Back in episode 55, we chatted about the main areas of functionality that you will likely run into while running a larger scale Production Container Deployment. Then, in episode 56, we chatted about Container Orchestration basics and deployed a Kubernetes cluster. Well, in this episode, I was thinking it would make sense to walk through what a very simple deployment pipeline looks like.
Lets jump over to the Containers In Production Map for a second. So, in episode 56, we chatted about how Orchestration is sort of the heart and soul of your Container Infrastructure. In this episode, I wanted to look at things like Version Control, Continuous Integration, Docker Registries, and Continuous Deployment. The idea here, is that we can automatically feed code changes into our Container Orchestration layer without doing much manual work. Lets zoom out for a minute, so we already chatted about this orchestration area, now we can going to cover the pattern for deploying changes automatically in this area.
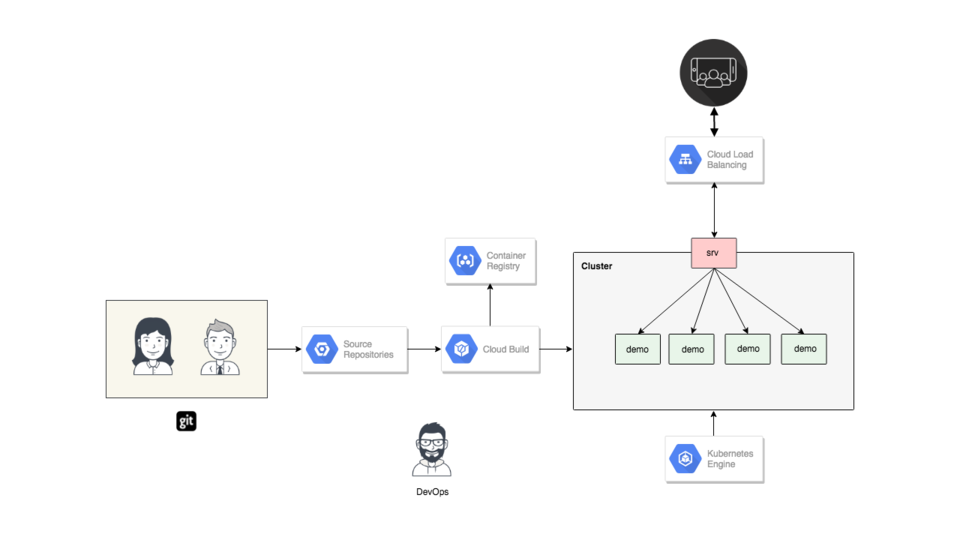
This is an architecture diagram of what we are going to be building today. So, down here we have our developers. They are going to be pushing changes into version control and that is going to trigger a build step. That build step will look at our code, pull down any dependencies, compile it, and build a Docker Container. From there, we are going to trigger a zero downtime rolling deployment across our Kubernetes cluster. This demo application is also served up to end users out on the internet, you can check it out too.
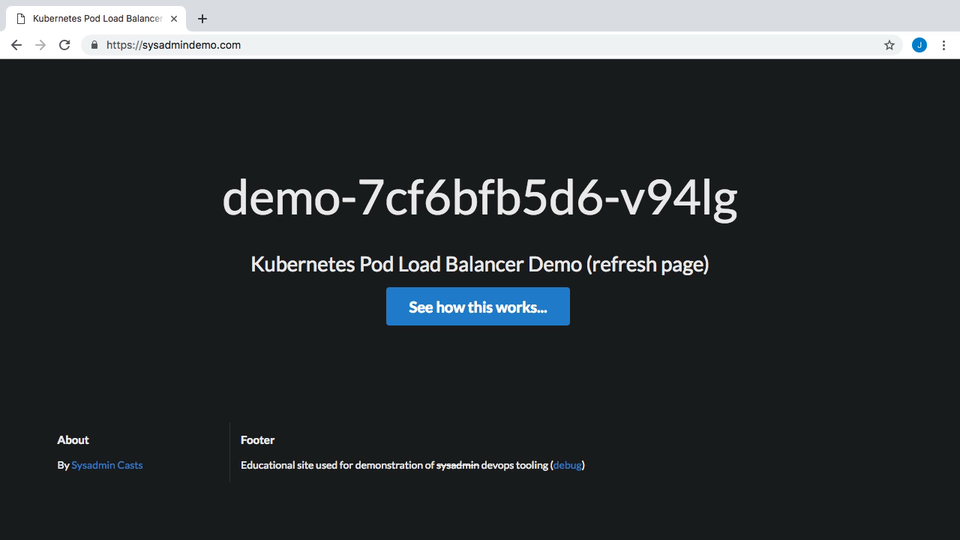
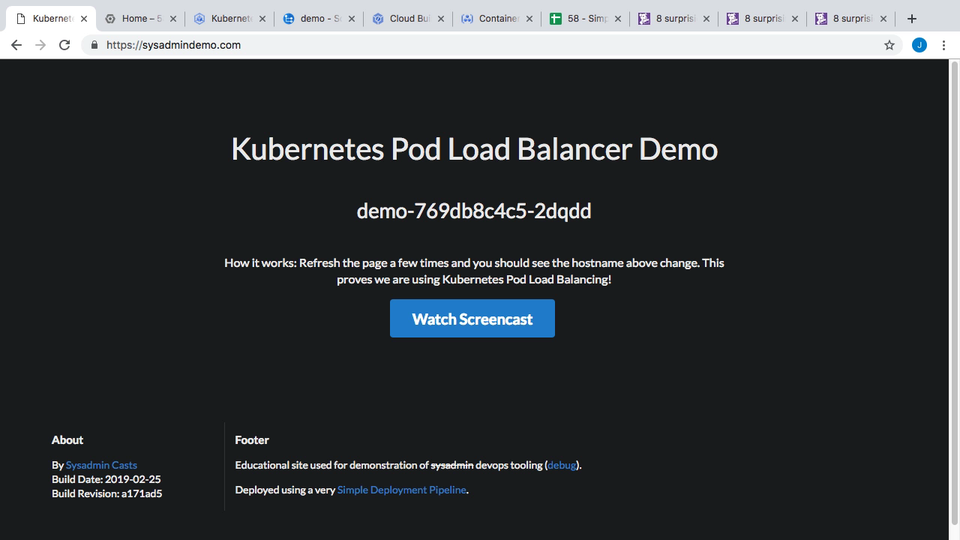
If you browse over to https://sysadmindemo.com/ you can see the website we will be updating. This was the demo website we used for in episode 56 for testing Container Load Balancing in Kubernetes. The idea, was that this website shows you the hostname of the container that served your request, and as you refreshed the page, this hostname changes. This proves out the idea that load balancing is working and there are multiple container instances running this website. There are some things I do not like about this website though. For example, I do not like how the hostname wraps across two lines sometimes, and I also think we should swap the hostname and title ordering around. The title should be up top and the hostname down below. These are some changes we will make, then automatically deploy, in just a few minutes.
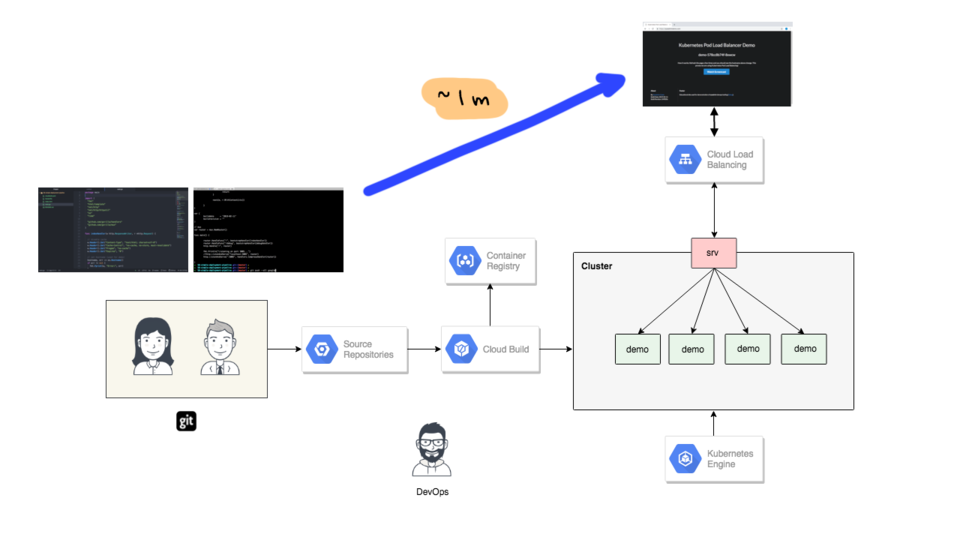
So, why do this at all? Well, lets jump back to the architecture diagram for a minute. So, we have our developers here, and they are using the typical stuff like a text editor, command line tools, and git. They have some awesome new features ready to release and they want to get this live as soon as possible. Sure, they could be manually deploying each and every change, but this increases their manual work, likely introduces human error, it also get pretty repetitive, not to mention, that as the team grows people will often be doing their own thing (basically skipping steps). So, it is nice to hide all this complexity and automate things by way of a Continuous Integration and Continuous Delivery pipeline. This not only makes developers lives much easier, but also increases the velocity at which your company can deploy changes out into production, and reduces the risk of each deploy causing havoc they are much smaller and easier to debug.
From my perspective, much of this tooling is just a necessary evil, in that you just want to push changes to end users as soon as possible. You do not really care how it happens under the covers as long as it works. Using something like this architecture gets you from a “git push”, to a live change in production, in around a minute. I should mention, in the demo today there are no guard rails. This is totally bare bones deployment pipeline, we are not doing any testing, or canary releases here, or anything like that. I just wanted to show the very minimum needed, then we can build this up, and explore how to make it much more robust. Basically, we are aiming for fast here and will make it safe later.
So, now that you have an idea of the high-level plan and motivation here, lets check out what is happening under the hood that makes this all possible. For the example today, we are going to be using Google Cloud, but honestly these boxes here are pretty swappable, and on pretty much every platform you will be looking for similar functionality. So, lets just blank things out here, and walk through the architecture step-by-step.
First, we are going to need a version control system. For the majority of people this is going to be Github, Bitbucket, or maybe a hosted internal version of Github Enterprise or something like that. Basically, you need a place to stash your source code.
Second, you are going to need something that will coordinate your Continuous Integration pipeline, or just CI system for short. This is pretty commonly Jenkins, maybe CircleCI, Travis CI, etc. So, we will configure your version control system, in a way that triggers a notification over to your CI system, that there is work to be done when new code get submitted by a developer. This trigger or notification, is often in the form of a webhook or something like that. After a notification from your version control system, your CI system will typically pull down all your source code, test it, compile it, build your packages, etc. This is also where a Docker Build typically happens.
Next, your CI system will build and push your application wrapped container, into a Docker Registry. Most Cloud providers have their own Registries, this include AWS, Google Cloud, Azure, etc. Tons of people are using Docker Hub too, or some private Registry instance they have installed. A good example of a private Registry, would be if you are using something like Red Hat’s Openshift.
From here, your CI system will likely trigger some type of deploy event. This is often called Continuous Delivery or Continuous Deployment, or just CD for short. For me, the lines between Continuous Integration and Continuous Delivery are pretty blurred. Often times, you will see one tool doing both jobs here, often times that is Jenkins. The reason I am chatting about this, is that lots of companies will market they have a CD offering. So, I just wanted to mention this as you will likely see if often mentioned. But, the core idea here, is that we need to trigger the Orchestration tool, and let it know that we have some changes we want it to deploy. For me, this is why Orchestration is so important, in that you can let it manage the rolling deployments and generally just take care of it for you. Without Orchestration, you the sysadmin, or devops person here, will likely have tons of manual work keeping tabs on things. If you have not seen it already, I would highly recommend watching episode 56, where I chat about this quite a bit.
Finally, we need a way to route user traffic into our cluster, so that it hits these newly deployed code changes. Again, this is where Orchestration plays a pretty big role, in that it will coordinate routing traffic to the correct containers for your latest code changes. Typically you do not normally need to worry about this other than setting it up initially. Or, if something breaks, and you need to debug it.
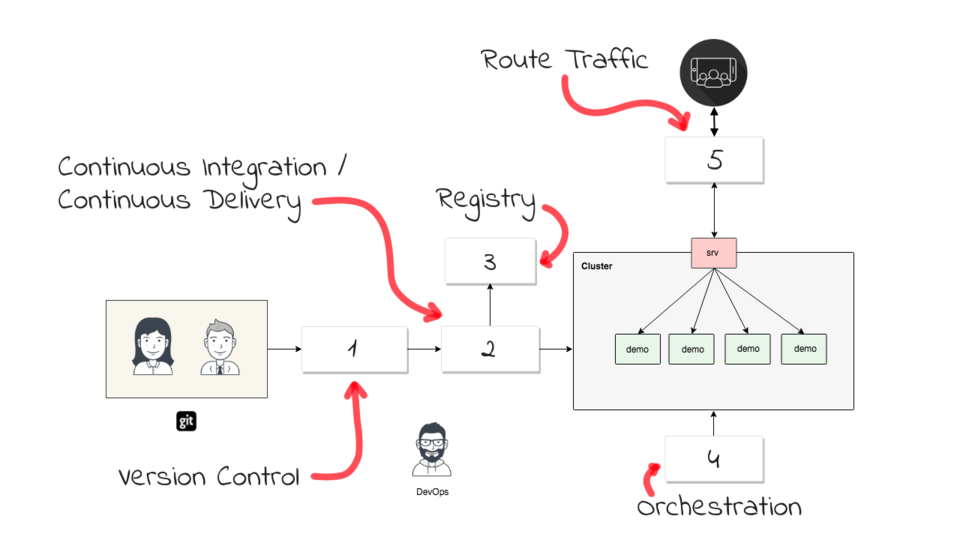
If you think of things in this abstract way, it doesn’t really matter the platform or orchestration tools you are using, in that you are just looking for this functionality. Personally, I would aim to create this workflow, by seeking out that tool available on whatever platform you are using. Sure, I am using Google Cloud for the demo today, but if you think of things from the perspective of functionality needed, you could easily map this into AWS too, or something else. This works really well if you need to translate between two platforms, or you get a new job at a company that is doing things a little different. You can easily adapt if you look at it this way. In this AWS example here, we are using Github, with Jenkins, using the AWS Container Registry, then using AWS’s Kubernetes offering, and fronting all this using an AWS Elastic Load Balancer. This is all extremely swappable, but the workflow, and end result is pretty much the same.
Alright, this is likely enough theory, lets actually make this happen by way of a demo. So, I have created an example project on Google Cloud, and we are going to build out that architecture piece-by-piece. By the way, this is the Google Cloud Console for anyone who has not seen it before.
First thing we need to do is configure a Git repo so that we can stash our website code used for the demo. If we go up to the hamburger menu up here, expand that, and select source repositories. I am just using the UI here, but you could easily use the command line, or better yet, something like Terraform to do this too. From here, we are going to say we want to add a new repository. From here, I am going to choose the option to create a new repository. You can also mirror an external repository, something like Github, so that you can still use this workflow. Next, I am going to call our new repo, demo. This takes just a minute. Next, I am going to choose, push code from a local repo, because I am going to be pushing code directly from my laptop into this repo. Then, I am going to choose the manually generate my credentials. Now, we can just use these two git commands like a normal remote repo and it all just works. I chose this option, as it fits pretty well with my existing workflows, so I am very used to it.
Lets flip over to the command line and connect things up to this git repo. In the local directory here, I have the websites index.html file, the main.go web server, a Dockerfile, and a cloudbuild.yaml file.
So, lets initialize this local directory as a git repository, by running git init. Then, if I run git status, you can see none of our files have been committed or pushed up yet. So, lets add them, by running, git add dot. Them, lets commit the changes, by running, git commit -m init commit.
So, if we flip back to the Cloud Console, lets copy this command to connect our local git repository up to the remote one. Then, if we switch back to the command line, lets paste that. Alright, so we have things wired up now, so that my local laptop can push changes into this git repo hosted on Google Cloud. But, I do not want to push any changes yet. I could, but I want to wait, because I want to configure that trigger for building things when new code is pushed. If, I just pushed things right now, nothing would happen.
$ ls -l -rw-r--r-- 1 jweissig staff 133 11 Feb 10:25 Dockerfile -rw-r--r-- 1 jweissig staff 685 11 Feb 00:07 README.md -rw-r--r-- 1 jweissig staff 718 25 Feb 11:18 cloudbuild.yaml -rw-r--r-- 1 jweissig staff 165849 26 Feb 00:42 index.html -rw-r--r-- 1 jweissig staff 3066 26 Feb 00:24 main.go $ git init Initialized empty Git repository in /Users/jweissig/58-simple-deployment-pipeline/.git/ $ git status On branch master Initial commit Untracked files: (use "git add..." to include in what will be committed) Dockerfile README.md cloudbuild.yaml index.html main.go nothing added to commit but untracked files present (use "git add" to track) $ git add . $ git commit -m "init commit" [master (root-commit) 4aa1013] init commit 5 files changed, 388 insertions(+) create mode 100644 Dockerfile create mode 100644 README.md create mode 100644 cloudbuild.yaml create mode 100644 index.html create mode 100644 main.go $ git remote add google https://source.developers.google.com/p/simple-deployment-pipeline/r/demo
If we look at that architecture diagram again, we just completed step one, for setting up version control, now we need to configure the CI/CD step, where we trigger events based of code being pushed into that git repository.
To do that, lets go back to the hamburger menu, and under Cloud Build, lets select triggers. This is how we are going to trigger event off new code submissions in that git repo. This basically says what I have already chatted about, in terms of triggering events off new code pushes.
Lets go ahead and create a trigger. We are going to select, Cloud Source Repository as the source of this event trigger, but you can also use Github or Bitbucket here too. Next, I am going to select that demo repository we created earlier. Then, we are asked how we want to configure the settings for firing off the trigger on events from that demo git repository. For me, I am mostly going to leave these as the default, but you could have this fire on a specific tag or branch.
The one thing I am going to change here, is this build configuration step, where you can choose how you want to define the actions that need to be taken when this event triggers. I want to use that cloudbuild.yaml file. I will show you what this file looks like in a second, but the gist of it is, this file is like a series of steps that outlines what needs to happen when this build trigger fires off. Alright, that’s it, lets create this trigger.
Great, so we now have our build trigger configured, so that when new code gets pushed into that demo repository, we will be looking for that cloudbuild.yaml file. So, lets jump over to an editor and have a look through the steps.
steps:
  - name: "gcr.io/cloud-builders/go"
    env: ["PROJECT_ROOT=web"]
    args: ["get", "."]
    id: "go-get"

  - name: "gcr.io/cloud-builders/go"
    env: ["PROJECT_ROOT=web"]
    args: ["install", "-ldflags", "-X main.buildrevision=$SHORT_SHA", "."]
    id: "go-install"

  - name: "gcr.io/cloud-builders/docker"
    args: ["build", "-t", "gcr.io/$PROJECT_ID/demo:$SHORT_SHA", "."]
    id: "docker-build"

  - name: 'gcr.io/cloud-builders/kubectl'
    args: ['set', 'image', 'deployment/demo', 'demo=gcr.io/$PROJECT_ID/demo:$SHORT_SHA']
    env:
      - 'CLOUDSDK_COMPUTE_ZONE=us-west1-b'
      - 'CLOUDSDK_CONTAINER_CLUSTER=XXXXXXXXX'
    id: "kubectl-deploy"

images: ["gcr.io/$PROJECT_ID/demo:$SHORT_SHA"]
Here is our website source code. I will post this up on Github, and add the link into the episode notes below, so that you can have a look if you want. So, lets have a look through the cloudbuild.yaml file. This file basically allows you to define steps or actions that need to be taken when this event is triggered. There are a bunch of supported build event types you can use, but we are using Go, Docker, and Kubernetes, in this one.
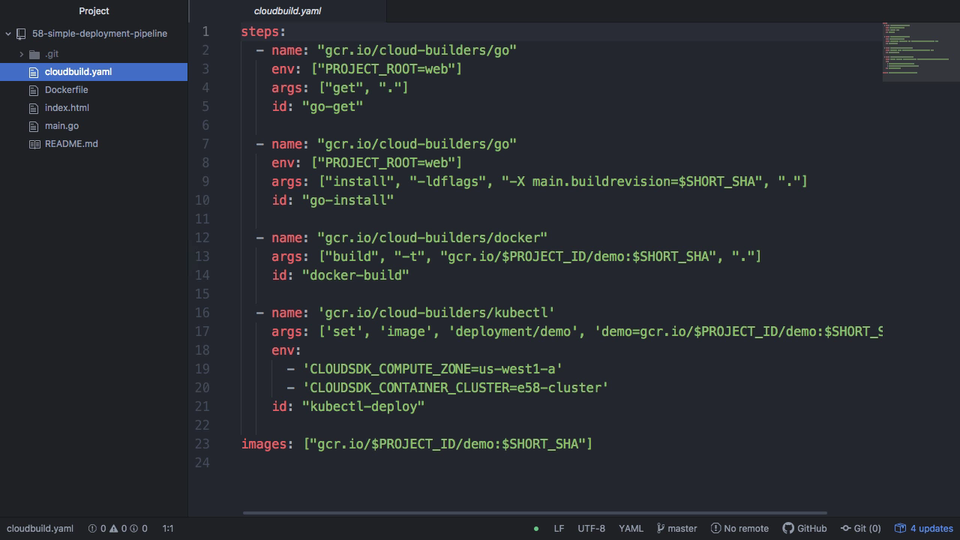
After the code has been pulled down by the event trigger. First, it is going to run a go-get step, this will pull down all the dependencies required to compile this application. Next, we are asking to have this application compiled. Once we have that compiled, lets build the Docker Container using our Dockerfile. Next, lets deploy this newly built application out into our production Kubernetes cluster. Finally, this is what our image is going to be called, demo, and then tagged with the git commit hash.
So, if we flip back to our architecture diagram for a minute, this cloudbuild.yaml file basically walks us through how the deployment should happen. We sync over the website code, pull down the dependencies, compile the application, build a docker container, and push that newly built container out to the registry. The next thing that needs to happen here, is we need to deploy this application into production, via step 4 here, by telling kubernetes that we want to update the currently running image with the one we just built.
Lets flip back to the code for a minute. So, the problem with this deploy step here, is that we are asking out CI/CD system to deploy something to Kubernetes. But, how do we handle permissions here? You will likely run into something similar no matter where you are doing this. For example, say you were using Jenkins running on AWS. You would need some way to authorizing Jenkins to deploy applications into your container platform. The way this is handled on Google Cloud is through service accounts. We will need to set that up.
So, lets go to the Cloud Console again, and I am going to find IAM or Identity and Access Management. Basically, we need to authorize this Cloud Builder tool access to deploy and update workloads in our Kubernetes cluster. So, I am going to update this Cloud Build account here, we can do that by clicking edit over here. Again, this is super specific to Google Cloud but you will likely run into something similar no matter where you are.
I am just going to add another role to this service account and allow it access to the Kubernetes cluster. Just scroll down here to Kubernetes and add the Kubernetes Engine Admin option. Then, click save. Perfect, now our Cloud Builder tool has access to actually deploy things into production once we have built them.
Lets jump back to the editor for a minute. So, we know what all these steps do now. This last step here is where we just added the permission to deploy. Without that permission added, our deployment step would fail with an error, saying we do not have permission to deploy workloads to Kubernetes.
One thing you will notice that is absent from this file is any testing steps. As I mentioned before, we are going for the bare minimum steps needed here to begin with. But, you would likely see lots of unit testing, some integration tests, and maybe a canary deploy happening here if this were well rounded. I just wanted to prove out the idea first and then we can refine it down the road.
Cool, so we are ready to push our code update out as everything has been configured. I should mention, that I already have a Kubernetes cluster running behind the scenes here, we configured that back in episode 56. The cluster is still configured to route traffic from https://sysadmindemo.com/ to our container instances running that website. So, we will be using that existing cluster and setup in this demo.
Lets head back to the Cloud Console, when we setting up our git repo, and were given the command to push changes out. Lets just copy this push command and head over to the command line and run it. This is taking our website formatting tweaks and pushing them into that demo git repo. This should have triggered our build steps too. So, lets jump over to the Console and have a look.
$ git push --all google
Counting objects: 7, done.
Delta compression using up to 4 threads.
Compressing objects: 100% (7/7), done.
Writing objects: 100% (7/7), 20.67 KiB | 0 bytes/s, done.
Total 7 (delta 0), reused 0 (delta 0)
To https://source.developers.google.com/p/simple-deployment-pipeline/r/demo
 * [new branch]      master -> master
If we refresh this page here we should now see our website source code now. Perfect, so that git push worked. Lets just verify the https://sysadmindemo.com/ website is still running the older version by reloading this a few times. Great, so now lets check on the progress of our build trigger step. I just want to verify we actually kicked off that trigger when we pushed code into that git repo. If we go over to the Cloud Builder, there is this history tab. Perfect, we can see something is happening here, and we have an event that was triggered when we push our code. Lets click in here and have a look.
This page will give you the details about this build event. As you can see, it is still in progress, and our build steps were pulled from that cloudbuild.yaml file and populated here. If you scroll down, there are some logged events about what is happening during the build process. Great, it looks like this just finished, you can see it took 32 seconds. Here, we get a breakdown of each build step, and the amount of time it has taken. Obviously, this is pretty bare bones, and you would likely see much longer build times if you were doing testing in here. But, I am using a very stripped down process just to prove things out. Then, if you scroll down here we have a complete build log, which can come in extremely handy when things break or a build fails for some reason. That is basically it for here.
I should probably show you the Docker Registry too. So, if we go back to the hamburger menu, and select Container Registry, that will hopefully show us our newly built Docker Image. Great, you can see here we have our newly built Docker Image, and if we click in here is should give us the details. You can see the image metadata here, like the image size is roughly 7 MB. This smaller image is also what makes this pipeline pretty fast. For example, if we needed to install a bunch of dependencies or update software, we could have easily spent a few minutes on just this build step.
Alright, lets actually verify the change was pushed out to production website now. Lets change over to our https://sysadmindemo.com/ tab. So, I wanted to change the formatting a bit here, and swap the title and hostname around. Lets reload the page and see if that happened. Great, it worked! If I reload the page a few times you can also see we are running multiple container instances in the background as the hostname of each instance that served the request is shown here. So, it all worked, we have our title change here, and the hostname down here now.
So, I know that was a long episode just to show you something that takes less than a minute to actually do. But, I wanted to walk through it like that, so that you can apply it pretty much anywhere. The goal here was to understand the workflow behind what is enabling developers to push changes live in less than a minute with zero downtime. Behind the scenes, it actually looks something like this, but can totally be abstracted away to look like this, so that you can hopefully apply it to wherever you are running your workloads.
Before we end things, I just wanted to flip back to the Cloud Console for a minute and show you the event logs in our Kubernetes Cluster. So, you can see here I have a five node cluster. Lets select the workloads option from the menu here. Then click into our demo application that runs our example website. This page will basically give you all types of data about the application and how it is currently running. There is the events tab here, that will show recent cluster operations, and you can see we have a bunch of scaling events. What happened here, is we had a rolling zero downtime deployment happen and here is the logging events for that. Instances of the new software was brought up as instance of the old software were downsized. So, there was two versions of our website briefly running to ensure a smooth transition.
Lets change back to our text editor for a minute. I just wanted to update the websites index.html footer, and add a comment about how this site is deployed using a very simple deployment pipeline (with a link to this episode). I am just going to uncomment this and save the file.
Lets change over to the command-line and push this change out. I like running git status just to verify what I think is happening is actually happening. Next, lets git add the file, and then git commit the change, finally, lets git push the change out. Perfect, looks like it was deployed again.
If we switch back to our browser here. You can see the footer does not have the change we just added. So, lets fresh the page a few times, it does take about 30 to 40 seconds to fully deploy. Okay, maybe in the few seconds I have here, I will quickly recommend checking out this Datadog report on Docker adoption. They sample something like 10 thousand customers and 700 million containers under their control. In their report, facts 4 and 8 walk through how container orchestration is quickly gaining speed and the typical lifespan of a container under orchestration is roughly 12 hours. I highly suspect that is because people are adopting automated workflows like this. Well worth the read.
Lets start refreshing this page again. I am not sure if you caught that but the footer was actually updated as we refreshed and then switched back. That is because we are doing a rolling zero downtime deployment in the background here and there is actually two versions of our application running until the rollout is complete. So, there you have it, a workflow for going from a git push to a fully deployed site in around a minute.
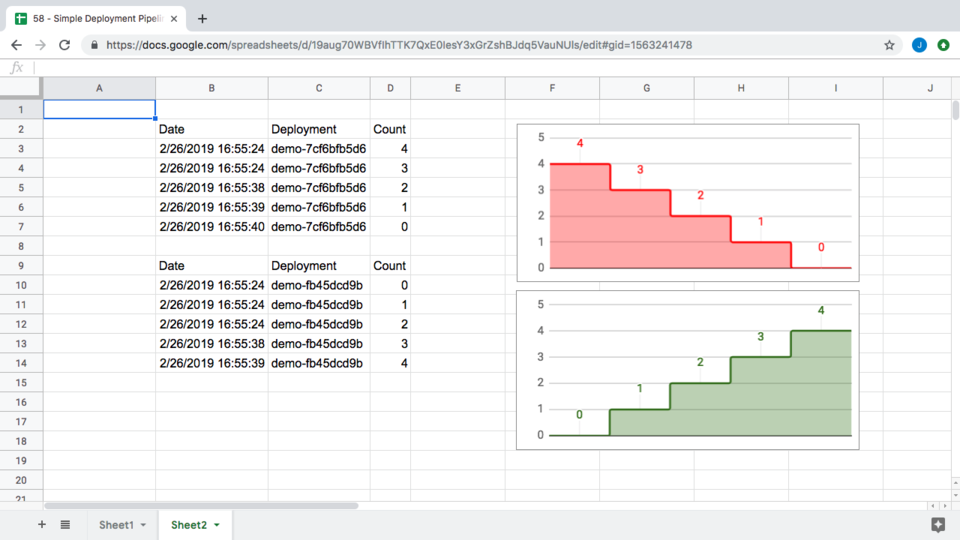
One final thing before I finish this episode. I wanted to help illustrate what is happening when we are running two versions of the application at the same time and what the rolling deployment actually looks like. I grabbed the logs and created this table of events. From the start of our deployment, to when it was fully deployed, took 39 seconds. That is pretty cool.
More interesting though are the rolling deployment graphs. Here are the graphs for the older version of the application that we are phasing out. You can see we went from 4 instances down to 0. Sort of this step function across time as we scale down. Then, here are the events for our new version of the application, you can see it went from 0 instances to 4, and was scaled up in a step function too. Both these event graphs overlapped, so for a period of time, both versions of the application were running here. One was going up and the other was going down. This is to ensure that we always have instances around to serve user requests.
Alright, that is it for this episode. I will see you next week. Bye.