- Istio - Connect, secure, control, and observe services
- Istio | Github
- Envoy Proxy
- Envoy Proxy | Github
- Envoy Proxy at Reddit
- Lyft’s Envoy: Embracing a Service Mesh
- Life of a packet through Istio by Matt Turner
- Istio - Weaving the Service Mesh
- Envoy stats
- #56 - Kubernetes General Explanation
- Installing Istio on GKE
- GKE - Enabling sidecar injection
- Istio > Traffic Management > Traffic Shifting
- Docker Hub - jweissig/istio-demo
- Github - jweissig/63-istio
In this episode, we are going to be taking a look at Istio. From my perspective, Istio lowers the barrier of entry for many advanced traffic management, security, and telemetry features. We will chat about what Istio is, what Envoy Proxies are, what a Service Mesh is, and then take a look at a few demos.
Alright, so lets dive in. The Istio documentation is pretty good at explaining what Istio is once you sort of understand the landscape. I have been thinking about how to explain this in simple terms for a while, and just wanted to walk you through it using a few diagrams and examples problem scenarios.
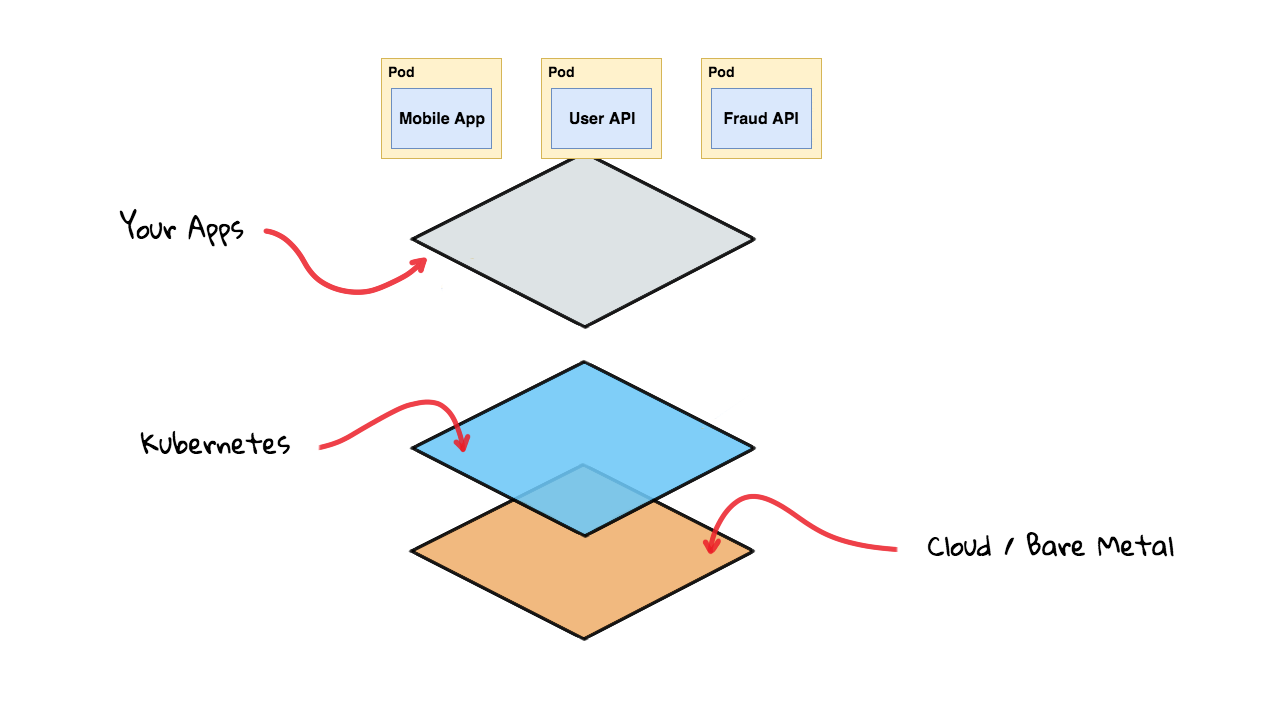
Lets quickly set the stage by recapping what we chatted about in episode #56, where we walked through Container Orchestration with Kubernetes. A fairly easy way to understand what Istio is, and where it fits into the larger picture, is to think of your production stack as a set of layers. At the bottom here, you will have your server nodes either sitting in a Cloud provider or maybe Bare Metal machines. Next, you are going to install the Kubernetes Master and Worker node software onto these server nodes. Finally, as we work our way up the stack, you are going to have your containerized applications sitting at the top here.
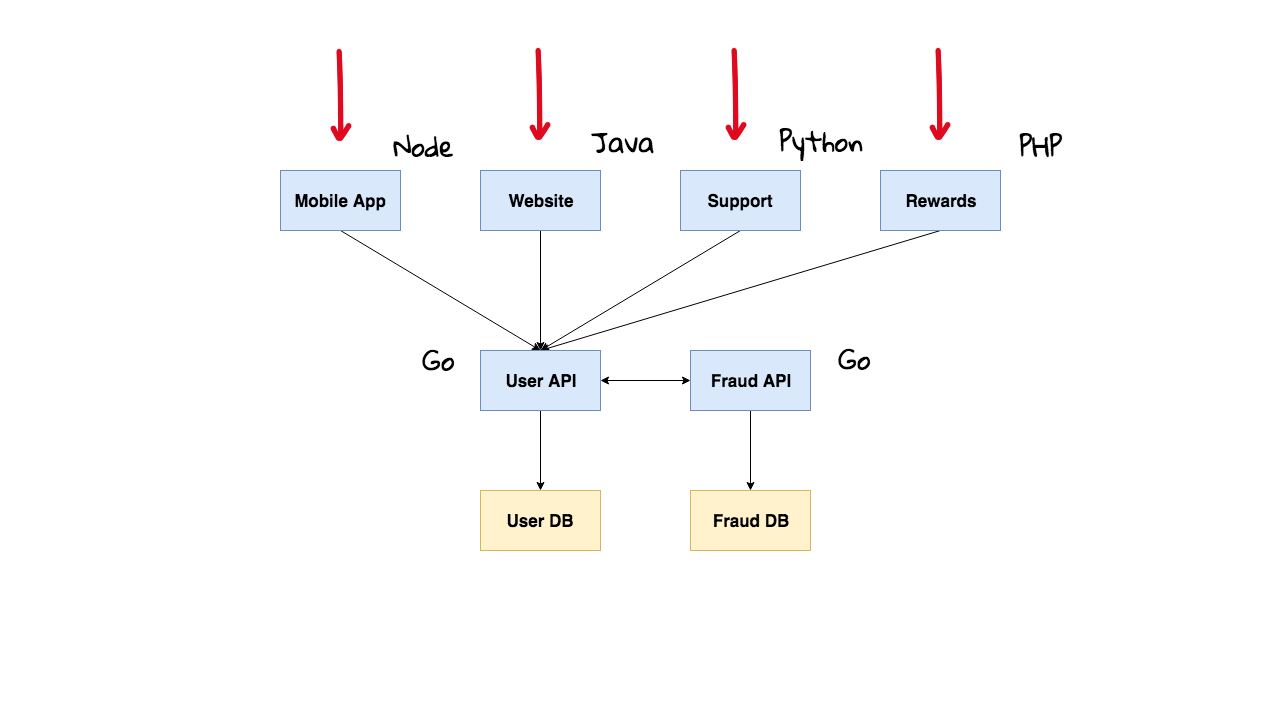
For now, that covers the server side of things. But what about the software side? Well, say you are an Enterprise type company and you have four main ways customers interact with your infrastructure, through your mobile site, your website, the support site, and rewards site. None of these systems are talking to each other, they each have their own user databases, and it is really ticking your customers off that they cannot login and see their purchase history, rewards, and anything else in a single place. This might sound like a totally stupid design for an Enterprise company and it is.
For example, I worked with a major Enterprise company where they had something like this happening and they wanted to consolidate all of this data into a single place. It was bad both for customers and for people working at this Enterprise company. When someone called support, the support staff had to look at lots of different databases to try and figure out the current state of the customer. They could not mine this data either for interesting trends. It ticked customers off too as they could not easily use the support site to return things. This happens quite often for larger companies as they often acquire smaller companies and then try and merger data between them. I am use you have a few examples of this too for companies you interact with.
Alright, so lets say they have an internal program to merge all these user databases into a single master instance and they want everything else to call this User API which will be a single point of entry for the users database. Now that everything is in a single place, they can now add advanced features like a Fraud API, where they can flag suspicious trends. In case you have not noticed we just created a pretty real world microservice infrastructure. By the way, I totally do not think you should adopt microservices unless you absolutely have too, as they will drive your complexity up.
Alright, so we have our new architecture and we are accepting traffic from the outside world into our four websites. For legacy reasons, each of these frontend services is written in different languages, we have Node, Java, Python, and PHP. Oh yeah, we wrote the new APIs using Go since we wanted it to be pretty performant. We have now created a total operations headache as it is super hard to get consistent tooling across all these services since they are written in different languages. Lots of times, these Enterprise companies do not even have software developers working for them that know this code, they hired external contractors to plan and execute the project. I know what you are thinking, what the heck does this have to do with Istio, and I am getting there I promise.
Alright, so this example company it still going through this technology transformation and they want to add custom traffic routing, maybe for doing A/B testing, or maybe they just want to redirect users on mobile to the mobile site. Maybe they want to do rate limiting as they have some abusing crawlers hammering their site and making it slow. Or, maybe they want to collect monitoring and metrics data across all these services they are offering now. The issue they are facing is that since they are using different programming languages it is hard to get a single consistent view, as some of these languages have really good support, and some totally lack support for what they are trying to do. So, they are constantly adding tons of logic into these services to try and make it consistent. Imagine building rate limiting in PHP, then in Python, and then in Java. Seems like a total waste of time to duplicate all this.
What about request tracing of debugging? Say for example, a request comes in on the mobile site, and hit the users API, then it makes a request to the fraud API, and finally returns the results. But, maybe the fraud API was really overloaded and the request took 25 seconds to complete. How can you actually tell that as the request touched all these system? You want that capability across all your services. You might be thinking that no company would use all these programming language. But, imaging a company with say fifty thousand employees across the globe, and you have lots of IT teams, spread out that are responsible for different services. All of the sudden, you can easily picture each team wanting to do their own thing. Then, you have some global operations team responsible for core infrastructure and security. These are vastly different problems than a single developer and a smaller startup might face.
What about security? Say for example, that someone is attacking your support site that normally accesses the users API using a restricted database username and password. The support site typically only has limited access to user data. However, they are successful and break into the support site and then use that to break into the website. For most of these large companies, once you break through the outer firewall, you have a much easier time on the inside. From here, they extract your database username and password for an account with much greater access, and start downloading your entire customer database. How can we configure a policy to only approve access from the support site to the user API, and block connections to the website? Or, maybe they try and connect directly to the fraud API and download data, how can we block that too? Well, this is where Istio comes in. It can help you with all these things. Let me explain how.
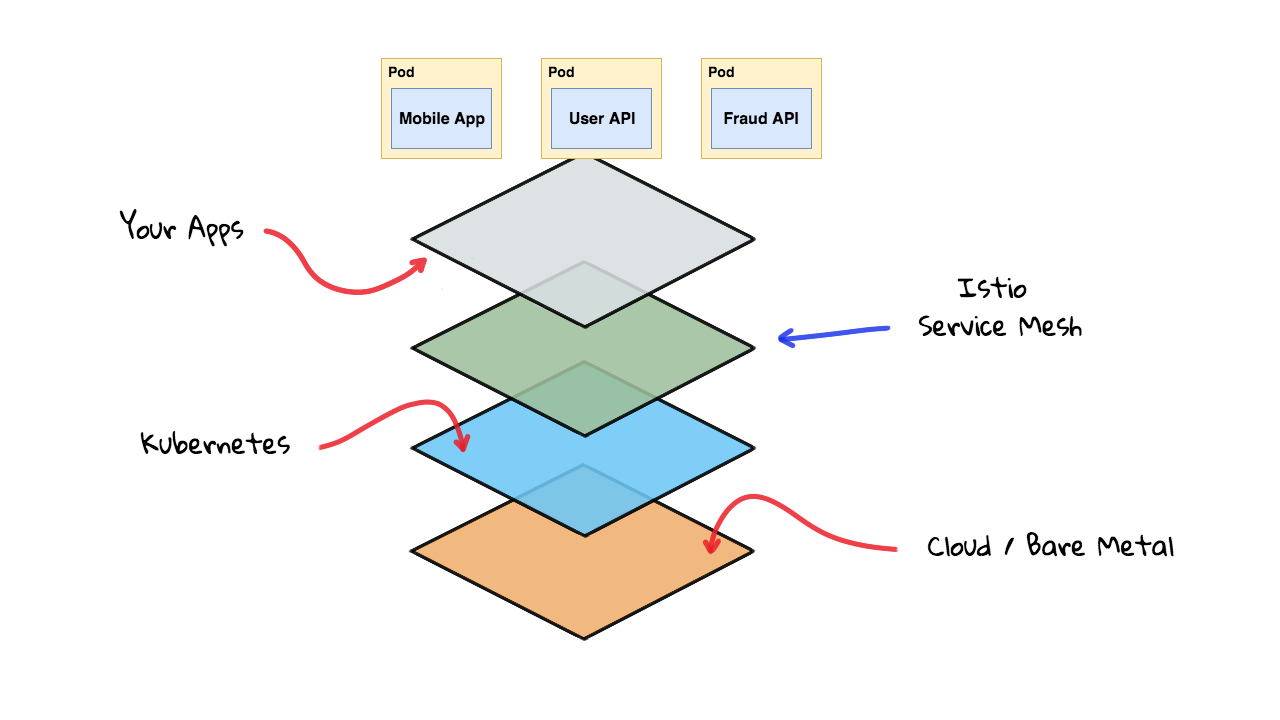
Alright, so lets flip back to the Kubernetes side of things for a minute. On the Kubernetes side of things, I see Istio sort of fitting into the picture here, sandwiched in between Kubernetes and your containerized applications. Istio runs many services on the Kubernetes cluster itself that your applications can seamlessly take advantage of.
Lets flip back to the application side of things and see how the architecture changes when we introduce Istio to our example. Alright, so as I mentioned earlier, Istio lowers the barrier of entry for many advanced features, things like traffic management, security, and telemetry features. Istio is designed to solve the exact problems we have been chatting about here. This almost seems like magic as how could it possibly do this across all these languages.
The way Istio works with Kubernetes, is that Istio will inject a sidecar traffic proxy called Envoy into each containerized service. This Envoy proxy, will intercept all incoming and outgoing traffic from your applications, no matter the language. Envoy works with raw TCP but also support HTTP, HTTP/2, Redis, and a handful of other protocols. So, you can write really sophisticated rules and logic and program it into this proxy. So, instead of applications talk to each other directly, communication is now flowing through all these proxies. Like this. This is all totally seamless to your applications too. They do not even know that traffic is being captured and redirected like this. Also, external traffic from the Internet is not flowing directly into these applications anymore, we are now capturing all external traffic and making that flow through the proxy too.
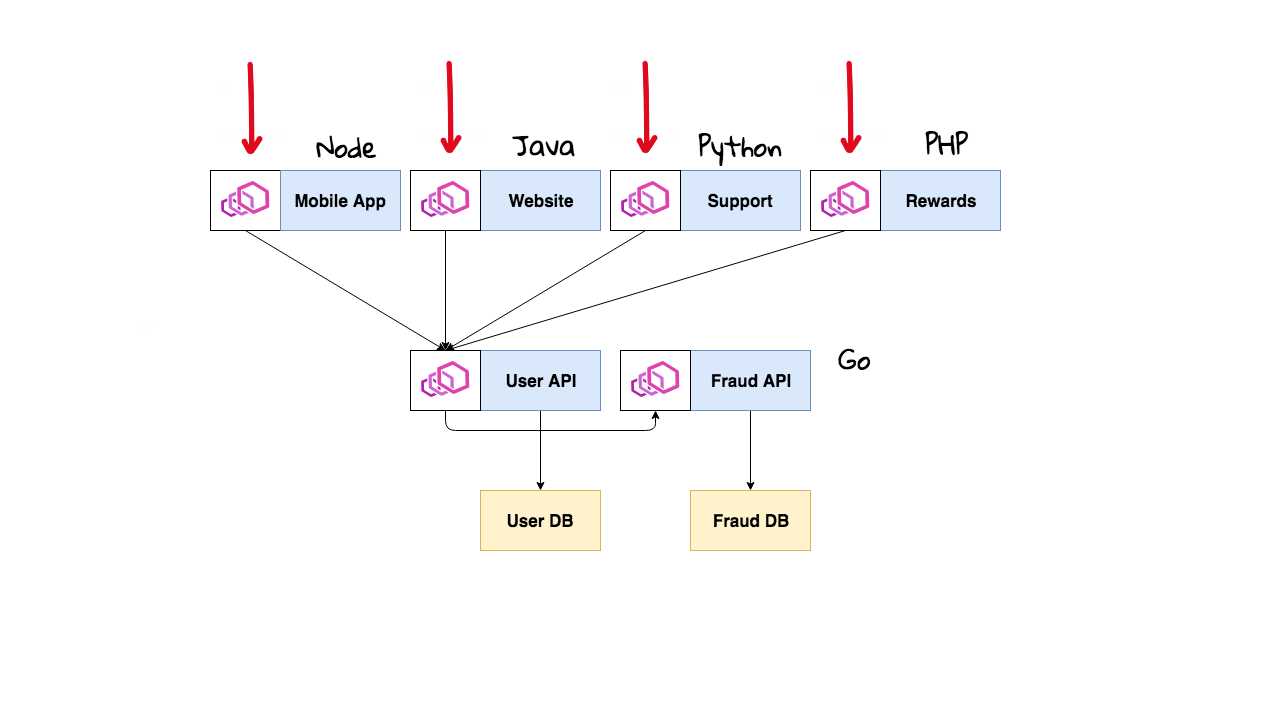
This is the core idea of what Istio supports. Now that you have this proxy in place, you can do all sorted of advanced stuff that the applications are not even aware of. You can redirect mobile traffic based of some user-agent HTTP header right at the proxy before it arrives at your application. These Envoy proxies also capture tons of metrics about requests, latency, who is talking to who, etc. So, now you have a complete map of all your services. Same goes for our rate limit use-case, we can program these proxies to say limit requests based on some IP address. You all of the sudden, have this really advanced layer, called a service mesh, giving you tons of advanced features across all your web services and you did not need to write custom code into your applications. This is the fundamental idea of what Istio is built for.
Sorry this example is so verbose, but I often find people explain the technology without giving the context of why someone would actually use this stuff. I wanted to focus on the use-cases and sort of the pain people have and why they seek out these types of tools.
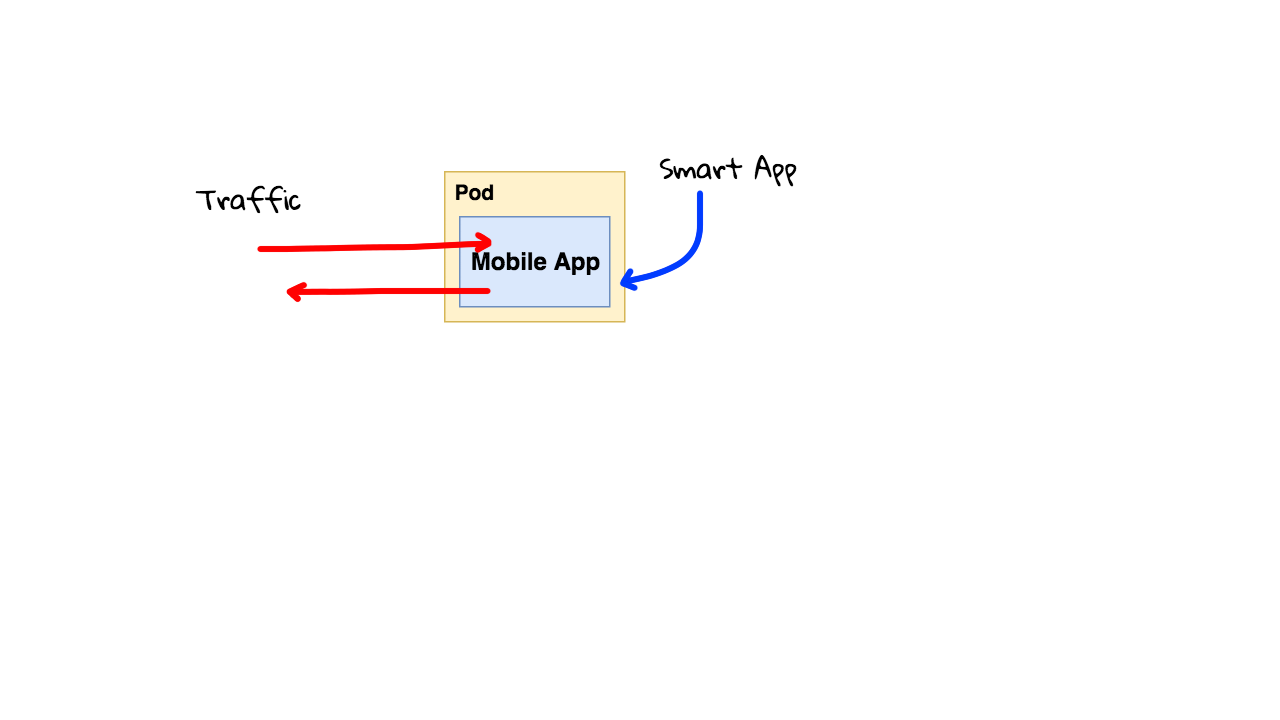
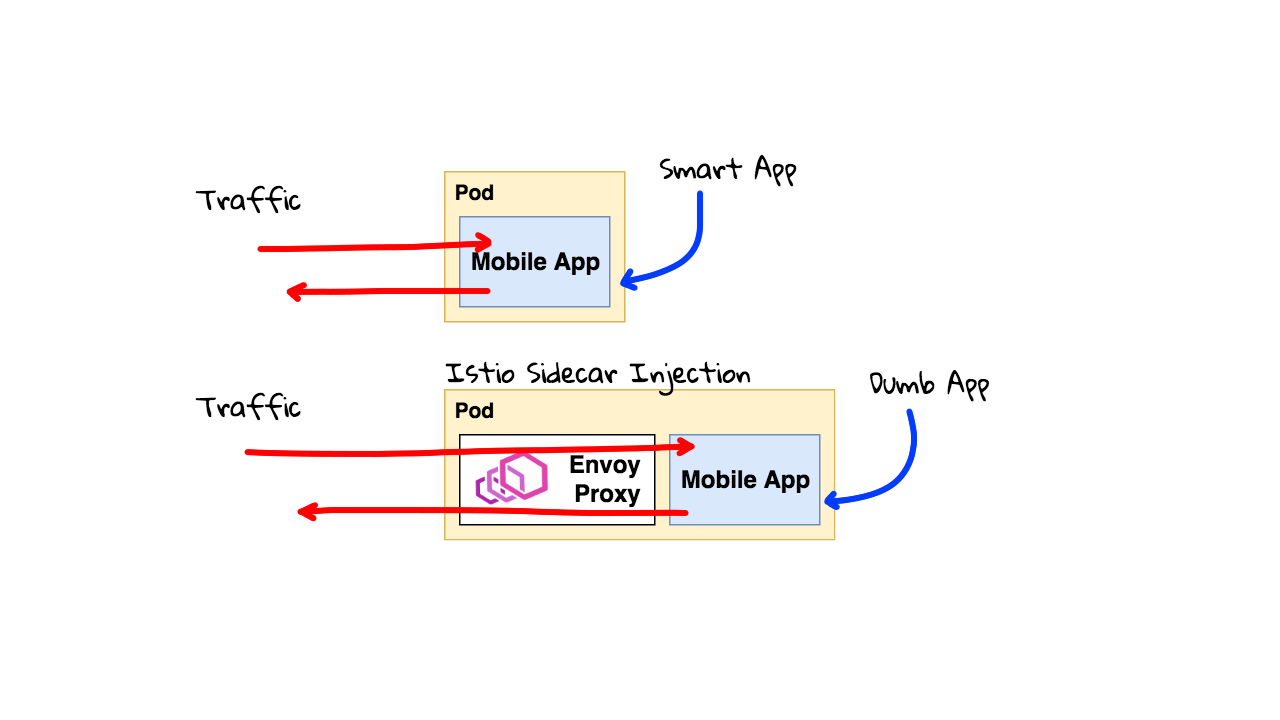
Alright, so lets chat about this sidecar injection and how it works. So, lets say you are running your application on Kubernetes without Istio. This is your mobile app. You are receiving and sending lots of traffic here. You need to have a pretty smart application that can deal with all your logging, monitoring, debugging, security, etc needs. This is really hard to get right across all your different services the company offers.
So, lets look at the same application, but on a Kubernetes with Istio installed. You can configure Istio to use silent container injection into your Pods. Basically, you want to run multiple containers that need to work together in a single pod. Like a co-located process. This pattern is often called a sidecar container. You can tell Istio, to inject this Envoy proxy sidecar container into any given pods in a Kubernetes namespace, or simply have it run in the default namespace. There is an init script that will run when this Pod is first started, that will configure the iptables rules, to capture all traffic in and out of your application, and have it flow seamlessly through the Envoy proxy sidecar container. Your application does not even know it is there.
Since, the Envoy proxy is seeing all data flowing in and out, we can now do cool things with it. This also allows you to strip out complex logic from your applications that is now handled by this Envoy proxy. So, you can almost make your applications thinner or dumber in a way. Istio can grab lots of metrics and monitoring data as traffic is flowing through. Same goes for security, we can now specifically say, this application is only allowed to talk to that application, and block anything else. We can now rate limit requests. You can use Istio to pass custom HTTP headers that your application to use to support things like distributed request debugging and tracing. You can do all types of traffic routing now too.
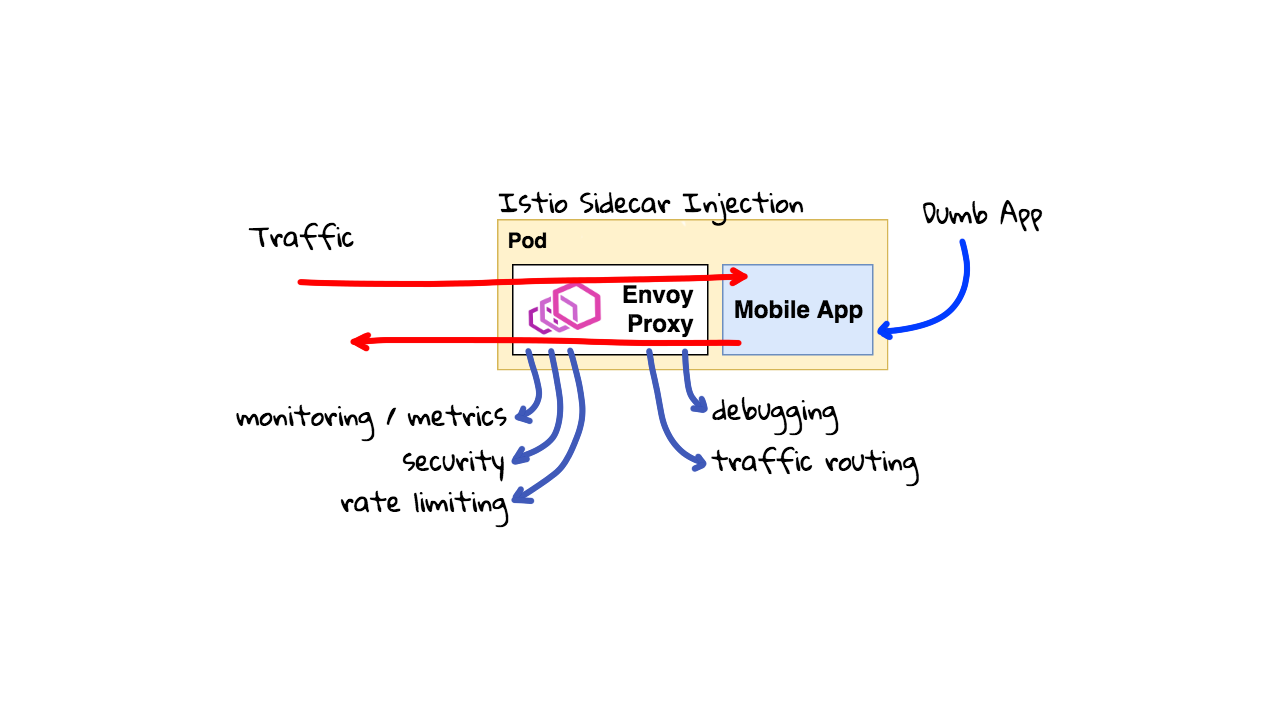
This Envoy Proxy using sidecar injection can give you tons of capabilities almost for free. So, lets chat about Envoy for a minute. This Envoy proxy is an open-source tool different than Istio, even though Istio uses it. So, you can almost think of Envoy is a really great tool, that Istio programs to do cool things. But, we will chat about that in a minute. Also, Envoy is the proxy written by Lyft and they use to everywhere in their infrastructure. It is written in C++ and designed to handle tons of traffic quickly. Obviously, you are paying a performance price, since this proxy is acting as a middle man for all your traffic. But, often times the price is small and the benefits are worth it. There is actually a really good deep dive just on the Envoy proxy in this Youtube video. I highly recommend checking it out if you are interested in playing around with Envoy or Istio. So, Lyft is using this for everything, but Reddit also mentioned how they are using Envoy too. They wrote a nice blog post about it too. The post goes into a few of the examples that I have already given as to why a company might want this. Just for the metrics and monitoring alone, it is often worth it, then you can slowly add more rules as needed.
Alright, lets flip back to the diagram for a minute. I will add all these links in the episode notes below if you want to check them out. The main takeaway here, is the Istio and Envoy are different projects. Even though, Istio packages Evoy with the installer to make it easy to user. I would consider Evoy to be really battle tested since you have these massive companies using it. You can think of Istio as the programmer and manager of all these Envoy proxies. Actually, the Istio project calls these Envoy proxies the data plane, and Istio the control plane, because Istio is programming them.
So, why are these companies not using Istio to program them? Well, Istio was sort of invented because most of the larger companies wrote custom code they use internally to program the Envoy proxies. So, Istio is sort of meant as an open-source controller that lots of companies and use. This is at least my take on it.
So, now that we have the Envoy proxy sitting in front of all our example applications it is trivial to get monitoring, logging, and metrics data data out of them. This will now be in a single format across all our services, without us doing much work. What about more advanced things? Well, this is where you want the control plane, or Istio to take over. You can tell Istio by way of YAML config files what you want each of these Envoy proxies to do.
Say for example, that you wanted to go through each of these and program them to rate limit traffic, that they can only talk to other approved services, etc. You get the idea. So, now if someone breaks into our support application, and then try and connect with the fraud API, we can have the Envoy proxy automatically block the connection since it is not approved to talk to it. Why not just use iptables rules for this? Well, often times in a containerized environment things are moving quickly, you have new versions of software rolling out all the time, you are scaling up and down, etc. It is way easier to have the proxy say, what services am I allowed to talk to, vs getting all the IP addresses and port numbers, and trying to keep that in sync manually. So, this pattern offers some real operational benefits too.
Alright, hopefully this all makes sense. So, I wanted to sort of lay the foundation of what is happening through diagrams and examples rather than reading from the documentation.
Now, lets go check out the Istio documentation. They have pretty technical pages, with lots of examples, and some really good introduction stuff. With the added context of my examples and diagrams this should make lots of sense when reading through this. This page, talks about what Istio is at a high-level, what a service mesh is, basically those smart Envoy proxies.
Here is a pretty good architecture diagram of what Istio is. You have all this control plane stuff down here. Pilot is used to program the Envoy proxies. The Mixer here is for monitoring, and policy enforcement, say for example that service A wanted to talk with service B, it would check with the Mixer to make sure it is allowed. Policy enforcement has a performance impact as you are doing these check live but there is lots of caching happening too. Actually, there is a really good talk, called Life of a packet through Istio, that explains all this stuff in super great detail. It is about 2 and a half hours long and walks you through all this stuff at a network level. Worth watching if you are actually going to install this for testing. Then there is Citadel, that allows you to configure encrypted pipes between all your Envoy proxies, basically allowing you to encrypt application traffic even though your applications might be talking in plain-text. Then you can sort of see here that the Istio control plane in programming and chatting with these Envoy proxies all the time.
One really cool thing about this website is this Tasks section here. From Traffic management stuff, like load splitting, traffic mirroring, fault injection, etc. Then you check out security, and lots of stuff around authentication and authorization, etc. Then down here, in the policy section, there is lots of stuff around how you can write rules, for things like rate limiting. Finally, you get into the telemetry section where this is all sorts of examples around metrics, logging, distributed tracing, etc.
So, lets go back and look at an example in the traffic management section here. Lets choose something like traffic shaping. This example allows us to split load between a couple services, say for example that you want to do a canary deployment of some new version of software. You wanted to deploy only a small faction of live traffic to it. You can use this YAML config file down here, to split the traffic 50-50 between version 1 and version 3 of your application. I think there was actually a good diagram of this, under the concepts section here, in the traffic management document. Yeah, if we scroll down a little here, there was a good example, actually these pages under the concepts section are packed with useful examples and really explain this well. Alright, so you can see we define a rule, via that YAML file that asks the the Istio Pilot process, to go and program the correct Envoy proxies with our rules. Then, the proxies will distribute traffic like we asked.
Lets maybe back up for a minute. So, we were looking at this Istio diagram that explains the Istio control plane, basically the server code Istio uses to take configuration from us, keep an eye on all these Envoy proxies, and push out new configurations. So, all these services, the Pilot, the Mixer, Citadel, etc all run on Kubernetes in containers too. Lets look at the server layered diagram again. So, we have Kubernetes, then Istio, then all your applications. Actually, we should show the Envoy proxy here too.
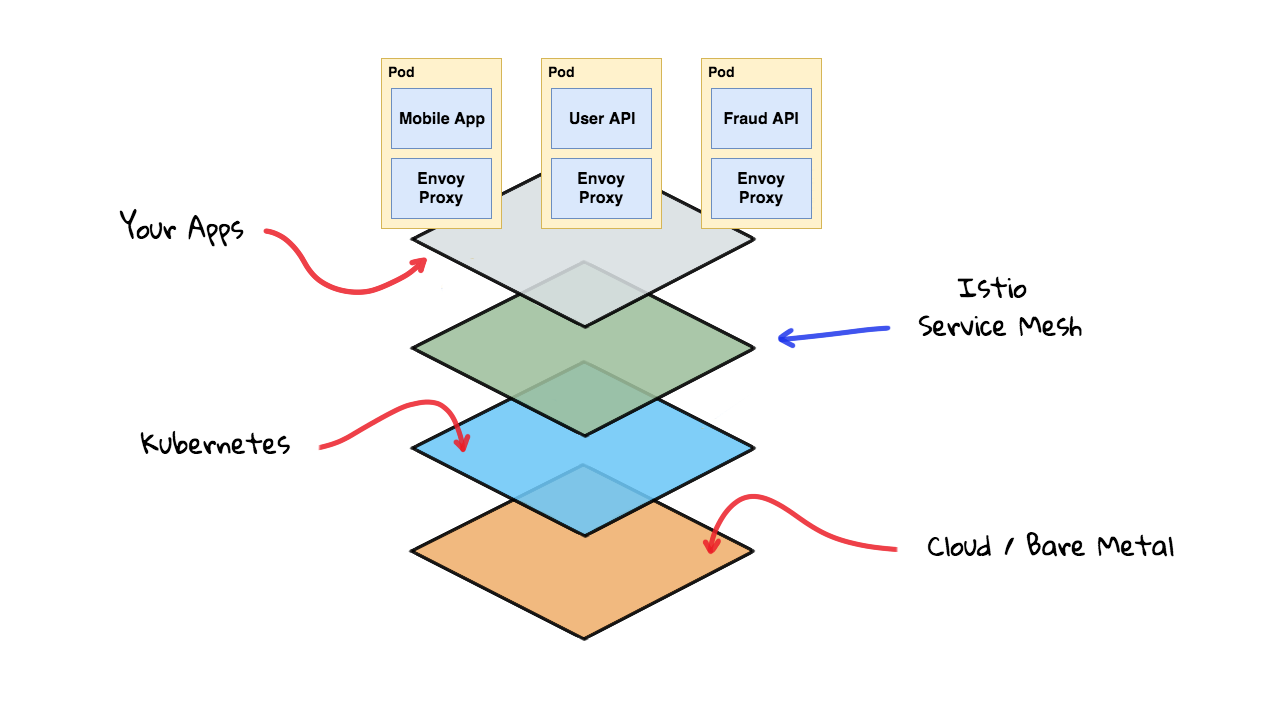
So, this is where things live. You have the Envoy proxy sitting here, seamlessly injected as a sidecar container in your applications, and then you have Istio and all it services also running on Kubernetes. Istio can actually be programmed right from the kubectl command as it augments the Kubernetes APIs. So, this is why I think of is almost like an extension of Kubernetes when you are using it like this. Worth mention, Istio also works with other platforms too, but I am only chatting about Kubernetes here. This diagram basically sums up my mental model of how all this works together. You can sort of envision how requests flow around using the other architecture diagram too.
Alright, so enough theory lets actually install a Kubernetes cluster with Istio and run some simple examples. I will add a few more episodes on this topic running through more complex architectures but wanted to get some foundational stuff down before doing that. If you have suggestions on what you want to see please let me know.
As we looked at in episode 56, Google Cloud allows you to easily spin up a Kubernetes cluster, but they also just added a beta feature to install Istio on the cluster too. This is pretty awesome as you can get a testing environment spun up in around 5 minutes. So, lets do that.
So, I am logged into the console here. I am going to go to the hamburger menu icon up here and select Kubernetes Engine. Then, we will select Create Cluster. Going to call this episode-63-testing. We will put the cluster in us-west1-a. A 3 node cluster is okay for now. Next, we will click this advanced option down here to tell this wizard we want to install the Istio beta feature. You just scroll down to the bottom here, and check this Enable Istio Beta checkbox. Then, lets create it. I am just going to pause the video as this step takes about 5 minutes and I will come back once the install is complete.
Alright, we are back and our Kubernetes cluster was created with Istio installed on it. So, how can we verify that? Well, lets click into the cluster here. You can see basic stuff about our cluster, like the version, nodes, etc. But, if we scroll down, under this add-ons section, you can see we have Istio enabled. But, since Istio is also running its servers on Kubernetes, can you also verify they are running and healthy too. We can do they by using this workloads tab here. You can see Citadel, Pilot, our sidecar injector service. This speaks back to the layered stack diagram I was showing you earlier.
So, lets deploy an example application and walk through that traffic splitting example. Where we have half the requests going to one version of the service, and the other half, going to a different version.
Lets head back to the cluster information page and click this connect button. This will open up a command prompt and authenticate us against this cluster. Alright, so we are authenticated now. You can read the docs about this, and I will add the link in the episode notes, but we need to turn on Istio so that it will inject our sidecars. Basically, it will not do this unless we tell it too.
$ gcloud container clusters get-credentials CLUSTERNAME --zone YOURZONE --project YOURPROJECT-123456789
Fetching cluster endpoint and auth data.
kubeconfig entry generated for CLUSTERNAME.
So, we are turning on istio sidecar injection for anything in the default namespace. This is just an example cluster, so this does not really matter, but you might want to use a specific testing namespace if you are sharing this cluster with someone else. I recommend just creating a testing cluster though.
$ kubectl label namespace default istio-injection=enabled
namespace/default labeled
Alright, so now lets deploy two version of the same app and create a service for them. One with version 0.1 and the other one with version 0.2. I have added the YAML files and source code via a Github link and also added the Docker Hub links if you wanted to check those out. All this app does it print the version of the app as output so that we can run our traffic splitting demo. So, what we are doing here is deploying two versions of our app and putting a service in front of that with a ClusterIP.
# 01-web-demo-versions.yaml
apiVersion: v1
kind: Service
metadata:
  name: web
  labels:
    app: web
spec:
  ports:
  - port: 5005
    name: http
  selector:
    app: web
---
apiVersion: extensions/v1beta1
kind: Deployment
metadata:
  name: web-v1
spec:
  replicas: 1
  template:
    metadata:
      labels:
        app: web
        version: v1
    spec:
      containers:
      - name: web
        image: jweissig/istio-demo:v0.1
        imagePullPolicy: IfNotPresent
        ports:
        - containerPort: 5005
---
apiVersion: extensions/v1beta1
kind: Deployment
metadata:
  name: web-v2
spec:
  replicas: 1
  template:
    metadata:
      labels:
        app: web
        version: v2
    spec:
      containers:
      - name: web
        image: jweissig/istio-demo:v0.2
        imagePullPolicy: IfNotPresent
        ports:
        - containerPort: 5005
If this does not make sense maybe checkout episode 56 and we chatting this in the networking section there. I have cloned all these script into my shell here. So, lets run this 01-web-demo-versions.yaml to deploy our apps.
$ kubectl apply -f 01-web-demo-versions.yaml
service/web created
deployment.extensions/web-v1 created
deployment.extensions/web-v2 created
You will also notice in the yaml file here we never mention anything about Istio, Envoy, or anything like that. You can also do this at the console by running kubectl get pods.
$ kubectl get pods
NAME                      READY     STATUS    RESTARTS   AGE
web-v1-856784475f-z4tff   2/2       Running   0          41s
web-v2-5c45fc7747-47j9s   2/2       Running   0          40s
So, how can we see if the Envoy sidecar container was actually injected by Istio? You can run, kubectl describe pod, and then the pod name at the command line here.
$ kubectl describe pod web-v1-856784475f-z4tff Namespace: default Priority: 0 PriorityClassName:Node: gke-episode-63-testing-default-pool-52d3ddaa-wnkz/10.138.0.24 Start Time: Fri, 22 Mar 2019 17:40:22 -0700 Labels: app=web pod-template-hash=4123400319 version=v1 Annotations: kubernetes.io/limit-ranger=LimitRanger plugin set: cpu request for container web sidecar.istio.io/status={"version":"8ce4319f058e4fd39ce0cc81ae1fff45d0d89dba6184ebfefff70377f3e7edd9","initContainers":["istio-init"],"containers":["istio-proxy"],"volumes":["istio-envoy","istio-certs... Status: Running IP: 10.4.2.6 Controlled By: ReplicaSet/web-v1-856784475f Init Containers: istio-init: Container ID: docker://0b49c45cf2b8fb610678db5dfd710157daf17f8ef911a634d9dbe880b0bac063 Image: gcr.io/gke-release/istio/proxy_init:1.0.3-gke.3 Image ID: docker-pullable://gcr.io/gke-release/istio/proxy_init@sha256:3aabbb198a0e7f1e87d418649e2d8d08d4cc9e6bf2bf361e0802edd6f6c7cf1e Port: Host Port: Args: -p 15001 -u 1337 -m REDIRECT -i * -x -b 5005 -d State: Terminated Reason: Completed Exit Code: 0 Started: Fri, 22 Mar 2019 17:40:31 -0700 Finished: Fri, 22 Mar 2019 17:40:31 -0700 Ready: True Restart Count: 0 Environment: Mounts: Containers: web: Container ID: docker://7e70e2a63c514017a1c56a3d1cc9a9624d4789c004608c2948f70d4875d25d3c Image: jweissig/istio-demo:v0.1 Image ID: docker-pullable://jweissig/istio-demo@sha256:8e18fcc6e172cb3cdfe32a589378cb294adb933ee6007f983b9018b584307019 Port: 5005/TCP Host Port: 0/TCP State: Running Started: Fri, 22 Mar 2019 17:40:34 -0700 Ready: True Restart Count: 0 Requests: cpu: 100m Environment: Mounts: /var/run/secrets/kubernetes.io/serviceaccount from default-token-8jf95 (ro) istio-proxy: Container ID: docker://f90ea92e8f7b3101faf3f022ef32117af8e6cc64718aa7235b0e4e336bc5d166 Image: docker.io/istio/proxyv2:1.0.3 Image ID: docker-pullable://istio/proxyv2@sha256:947348e2039b8b0e356e843ae263dc0c3d50abbf6cfe9d676446353f85b9ccb7 Port: 15090/TCP Host Port: 0/TCP Args: proxy sidecar --configPath /etc/istio/proxy --binaryPath /usr/local/bin/envoy --serviceCluster web --drainDuration 45s --parentShutdownDuration 1m0s --discoveryAddress istio-pilot.istio-system:15007 --discoveryRefreshDelay 1s --zipkinAddress zipkin.istio-system:9411 --connectTimeout 10s --proxyAdminPort 15000 --controlPlaneAuthPolicy NONE State: Running Started: Fri, 22 Mar 2019 17:40:49 -0700 Ready: True Restart Count: 0 Requests: cpu: 10m Environment: POD_NAME: web-v1-856784475f-z4tff (v1:metadata.name) POD_NAMESPACE: default (v1:metadata.namespace) INSTANCE_IP: (v1:status.podIP) ISTIO_META_POD_NAME: web-v1-856784475f-z4tff (v1:metadata.name) ISTIO_META_INTERCEPTION_MODE: REDIRECT ISTIO_METAJSON_ANNOTATIONS: {"kubernetes.io/limit-ranger":"LimitRanger plugin set: cpu request for container web"} ISTIO_METAJSON_LABELS: {"app":"web","pod-template-hash":"4123400319","version":"v1"} Mounts: /etc/certs/ from istio-certs (ro) /etc/istio/proxy from istio-envoy (rw) Conditions: Type Status Initialized True Ready True ContainersReady True PodScheduled True Volumes: default-token-8jf95: Type: Secret (a volume populated by a Secret) SecretName: default-token-8jf95 Optional: false istio-envoy: Type: EmptyDir (a temporary directory that shares a pod's lifetime) Medium: Memory istio-certs: Type: Secret (a volume populated by a Secret) SecretName: istio.default Optional: true QoS Class: Burstable Node-Selectors: Tolerations: node.kubernetes.io/not-ready:NoExecute for 300s node.kubernetes.io/unreachable:NoExecute for 300s Events: Type Reason Age From Message ---- ------ ---- ---- ------- Normal Scheduled 5m default-scheduler Successfully assigned default/web-v1-856784475f-z4tff to gke-episode-63-testing-default-pool-52d3ddaa-wnkz Normal Pulling 5m kubelet, gke-episode-63-testing-default-pool-52d3ddaa-wnkz pulling image "gcr.io/gke-release/istio/proxy_init:1.0.3-gke.3" Normal Pulled 5m kubelet, gke-episode-63-testing-default-pool-52d3ddaa-wnkz Successfully pulled image "gcr.io/gke-release/istio/proxy_init:1.0.3-gke.3" Normal Created 5m kubelet, gke-episode-63-testing-default-pool-52d3ddaa-wnkz Created container Normal Started 5m kubelet, gke-episode-63-testing-default-pool-52d3ddaa-wnkz Started container Normal Pulling 5m kubelet, gke-episode-63-testing-default-pool-52d3ddaa-wnkz pulling image "jweissig/istio-demo:v0.1" Normal Pulled 5m kubelet, gke-episode-63-testing-default-pool-52d3ddaa-wnkz Successfully pulled image "jweissig/istio-demo:v0.1" Normal Created 5m kubelet, gke-episode-63-testing-default-pool-52d3ddaa-wnkz Created container Normal Started 5m kubelet, gke-episode-63-testing-default-pool-52d3ddaa-wnkz Started container Normal Pulling 5m kubelet, gke-episode-63-testing-default-pool-52d3ddaa-wnkz pulling image "docker.io/istio/proxyv2:1.0.3" Normal Pulled 5m kubelet, gke-episode-63-testing-default-pool-52d3ddaa-wnkz Successfully pulled image "docker.io/istio/proxyv2:1.0.3" Normal Created 5m kubelet, gke-episode-63-testing-default-pool-52d3ddaa-wnkz Created container Normal Started 5m kubelet, gke-episode-63-testing-default-pool-52d3ddaa-wnkz Started container
If we scroll up here, you can see references like about the sidecar here, then things about the init scripts, this is where the init script is configuring iptables rules to intercept all in and out traffic and pipe that through Envoy. Basically, going back to this diagram here, where we injected the sidecar container, and then seamlessly intercept all traffic without our application even knowing about it.
Then, if we scroll down here, you can see the co-located containers running in this pod. We have the demo application that I created and then this istio proxy one here (which is Envoy). Pretty cool right. Just seamlessly plugs it and we get all this cool stuff for free. I think that is probably all we need to check out as this proves it is working.
Alright, lets run our second script here. This script creates an Istio gateway for accepting external traffic from the internet on the istio ingressgateway and routing it into our cluster.
# 02-web-demo-service-gateway.yaml
apiVersion: networking.istio.io/v1alpha3
kind: Gateway
metadata:
  name: web-gateway
spec:
  selector:
    istio: ingressgateway # use istio default controller
  servers:
  - port:
      number: 80
      name: http
      protocol: HTTP
    hosts:
    - "*"
---
apiVersion: networking.istio.io/v1alpha3
kind: VirtualService
metadata:
  name: web
spec:
  hosts:
  - "*"
  gateways:
  - web-gateway
  http:
  - match:
    - uri:
        exact: /
    route:
    - destination:
        host: web
        port:
          number: 5005
Next, we are going to create a Istio virtual service, that will bridge the gap between our demo web instances and the istio gateway. Basically, we are routing traffic from the internet, through Istio, and into our demo containers. Lets jump over to the console and apply this YAML config.
$ kubectl apply -f 02-web-demo-service-gateway.yaml
gateway.networking.istio.io/web-gateway created
virtualservice.networking.istio.io/web created
Alright, so the Istio gateway was configured. Lets get the ingressgateway IP address by running this command. This is our external address here. So, lets open that up and see what it says. Great, so you can see it says version 0.1 and version 0.2. These are our two demo instances. So, we have traffic routing through the Envoy proxy now.
$ kubectl get svc istio-ingressgateway -n istio-system
NAME                   TYPE           CLUSTER-IP     EXTERNAL-IP     PORT(S)                                                                                                                   AGE
istio-ingressgateway   LoadBalancer   10.7.255.162   104.198.4.238   80:31380/TCP,443:31390/TCP,31400:31400/TCP,15011:30934/TCP,8060:30564/TCP,853:30161/TCP,15030:30226/TCP,15031:32378/TCP   55m
We can jump back to the command line and run this little for loop that will make calls to our application and then we can count them. So, you can see 10 requests here. Then, lets pipe that to sort, and then lets count these up, with unique dash c. You can see we have an even split here. Check out episode 28, where I chat about this cool counting trick.
$ for i in `seq 1 10`; do curl -s http://104.198.4.238/; echo; done
Version: v0.2
Version: v0.1
Version: v0.2
Version: v0.1
Version: v0.2
Version: v0.1
Version: v0.2
Version: v0.1
Version: v0.2
Version: v0.1
$ for i in `seq 1 10`; do curl -s http://104.198.4.238/; echo; done | sort | uniq -c
5 Version: v0.1
5 Version: v0.2
Alright, so lets say we wanted to only send a portion of traffic to version 2 of our application. Well, in the third script, we are creating this destination rule that breaks our demo apps into two groups, one for version 1, and one for version 2.
# 03-web-demo-80-20.yaml
apiVersion: networking.istio.io/v1alpha3
kind: DestinationRule
metadata:
  name: web
spec:
  host: web
  subsets:
  - name: v1
    labels:
      version: v1
  - name: v2
    labels:
      version: v2
---
apiVersion: networking.istio.io/v1alpha3
kind: VirtualService
metadata:
  name: web
spec:
  hosts:
  - "*"
  gateways:
  - web-gateway
  http:
  - route:
    - destination:
        host: web
        port:
          number: 5005
        subset: v1
      weight: 80
    - destination:
        host: web
        port:
          number: 5005
        subset: v2
      weight: 20
Then we can tell that virtual server down here, to send 80 percent of the traffic to group version 1 and the other 20 percent to group version 2. So, lets jump back to the console and apply that rule.
$ kubectl apply -f 03-web-demo-80-20.yaml
destinationrule.networking.istio.io/web unchanged
virtualservice.networking.istio.io/web configured
Alright, lets run our curl for loop script again and see what that did. Looks like it is mostly working here as a larger number goes to version 1 than version 2. Lets bump the requests up to 100 and see what that looks like. Great, looks like our weighted traffic rule is working. This is all happening seamlessly to our application and we did not need to do anything special here.
$ for i in `seq 1 10`; do curl -s http://104.198.4.238/; echo; done | sort | uniq -c
7 Version: v0.1
3 Version: v0.2
$ for i in `seq 1 100`; do curl -s http://104.198.4.238/; echo; done | sort | uniq -c
77 Version: v0.1
23 Version: v0.2
The forth script here, just changes 95 percent of the traffic to go to version 2 and 5 percent to version 1.
# 04-web-demo-5-95.yaml
apiVersion: networking.istio.io/v1alpha3
kind: DestinationRule
metadata:
  name: web
spec:
  host: web
  subsets:
  - name: v1
    labels:
      version: v1
  - name: v2
    labels:
      version: v2
---
apiVersion: networking.istio.io/v1alpha3
kind: VirtualService
metadata:
  name: web
spec:
  hosts:
  - "*"
  gateways:
  - web-gateway
  http:
  - route:
    - destination:
        host: web
        port:
          number: 5005
        subset: v1
      weight: 5
    - destination:
        host: web
        port:
          number: 5005
        subset: v2
      weight: 95
So, lets apply that script. Then, lets run our for loop again and test to see if it is working. Pretty cool right?
$ kubectl apply -f 04-web-demo-5-95.yaml
destinationrule.networking.istio.io/web unchanged
virtualservice.networking.istio.io/web configured
for i in `seq 1 100`; do curl -s http://104.198.4.238/; echo; done | sort | uniq -c
 5 Version: v0.1
95 Version: v0.2
This is just a proof of concept. But, you can use this as a starting point to explore what these rules can actually do. If we head back to the Istio documentation, you will find tons of examples in here, for all types of traffic management, security, etc. Maybe try rate limiting on your own. Or, maybe throwing an error for a percentage of the traffic. This could be really useful for testing how systems react when things go badly.
Well, that pretty much wraps things up. I wanted to mention that right now, I think of Istio as an early adopter technology without too many publicly referenceable use-cases. It is quickly gaining traction and I suspect over the next couple cycles of conferences we will see more and more referenceable companies appear. I wanted to do this episode more of an early look at something pretty cool being worked on vs something you should implement today.
Alright, that is it for this episode. Thanks for watching and I will see you next week. Bye