- draw.io
- AWS Architecture Icons
- AWS Architecture Center
- GCP Official Icons and Sample Diagrams
- GCP Official Icons and Solution Architectures
- Architecture Diagram Template
In this episode, I wanted to share a few tips for how I create architecture diagrams. Often times you need to write technical documentation, or share knowledge with other team members, and having an architecture diagram can really help. Here’s what works for me.
Chances are, if you are working as a Sysadmin or in some Ops related role, you are likely doing a fair amount of technical writing. Personally, I find having even a simple high-level diagram can help explain your point of view, and it helps give context to your technical documents.
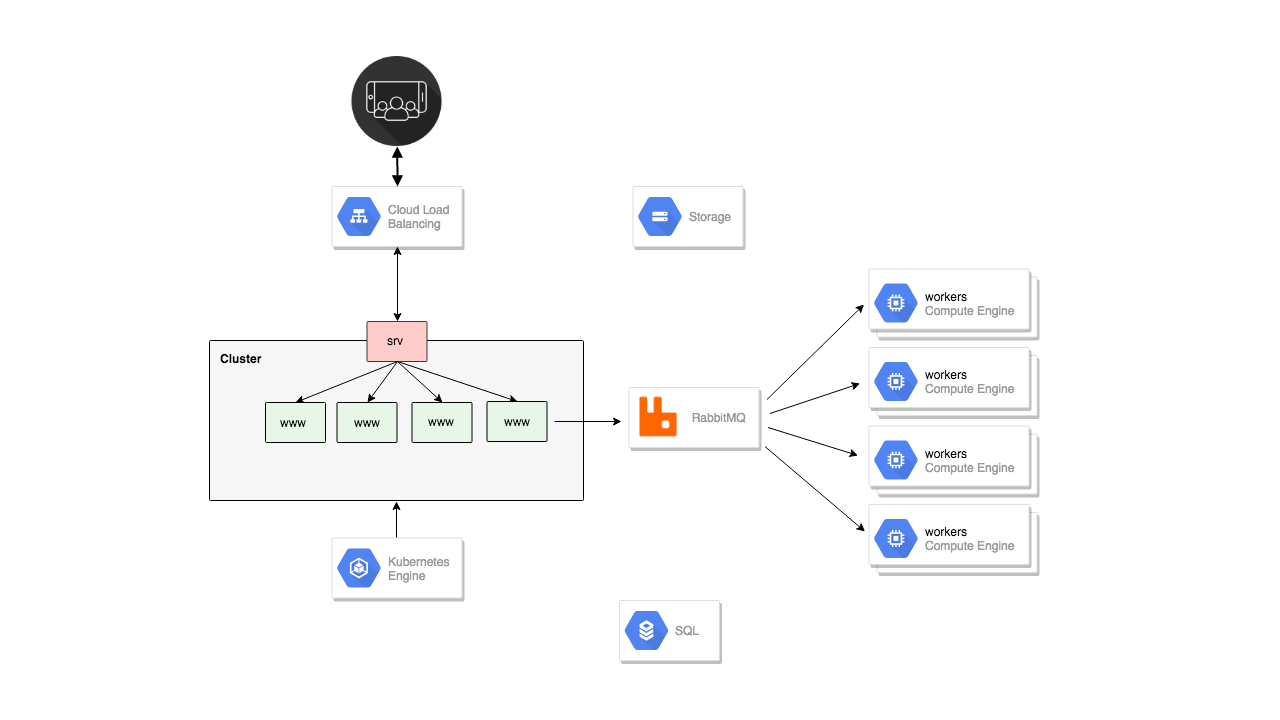
So, I wanted to walk through a few of the techniques I use for creating these. I also wanted to share how I create some of these animations to help give life to an architecture diagram. I find these simple animated slides with arrows really helps to drive attention to what you are chatting about. Hopefully you will find this useful.
Alright, so lets dive in. I use Draw.io to create most architecture diagrams and then I will use something like Gimp or Photoshop to add graphics and arrows on top. Draw.io is really great, pretty simple to use, and free. In a couple minutes we will actually walk through creating a diagram together.
Next, I use the AWS Architecture Icon pack quite a bit too. This is where you can download all the AWS icons for creating your own diagrams. Draw.io already has them baked in though. But, say you wanted to create some custom graphic, or wanted to overlay one of these into some documentation, you could totally use these. They are all down here, you can just download them and pluck out what you are interested in. Then, down here, there are a bunch of different tools you can use for creating diagrams. Out of all of these, I have only used Draw.io, so if you found something else that works really well, send me a note.
Next, I often use this AWS Architecture Center site when looking for inspiration or just need a place to start when figuring out how to present something. So, you can use this site to get a feel for what a well laid out architecture diagram might look like. If you scroll down here, they have a tons of reference architectures too, and you could literally spend hours reading through these. This is also a good place to find out what a particular architecture might look like. Say, you are a gaming company, and want to do some research in how other folks are doing it. This looks a little busy but you might read through this and get some useful tips for deploying gaming infrastructure on AWS. Pretty handy resource when you are looking for a starting point.
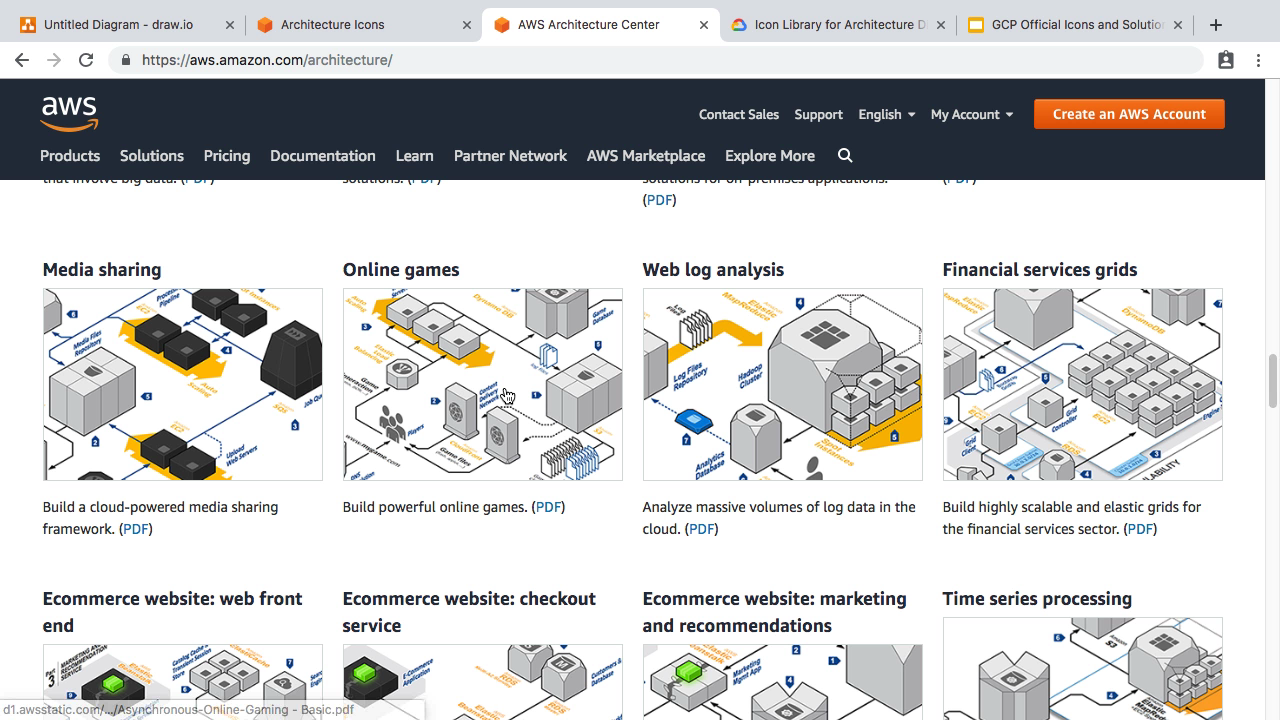
One tip here, is you will often find these diagrams flowing from left to right. In that traffic typically starts with the users request on the left and flows to the right. You will also see this happen top to bottom. So, I typically try to stay with these unwritten rules too unless there is a good reason.
Google Cloud has pretty much the same two sites. You have the Icon packs where you can download these images for use in your presentations. I think that is pretty much it for this page as they just want you to check out the slide deck. So, lets check that out. Google also has these example architecture diagrams too in this slide deck. I have it opened in this other tab. There is about a hundred slides in here, that walk you through lots of different architectures. So, you can pretty much browse through here and pick and choose what you are looking for. I typically don’t like creating architecture diagrams in slide form though, as it is really tough to get your alignment correct and it is a pain to add graphics. But, there are lots of good examples in here if you are looking for inspiration.
I am sure similar Icon packs exist for Azure or Digital Ocean too. I just have not looked. That is pretty much it for resources. If you are running your own bare metal hardware, then you can just use the generic icons, etc. Alright, lets jump back to Draw.io.
Before we create anything, I just wanted to chat about the reason you are even creating this thing in the first place. I typically go through the who, what, why, and when, type questions when creating something. Does this just need to be quick and dirty? Are you creating something for a large presentation? Duplicating what came out of a whiteboard photo session.
Before I even create anything, I will often just sketch this out with a pen and paper long before I get into this tool. Just because I find it way easier to throw around ideas quickly without the computer. You are totally free to try 10 ideas quickly and walk through it in your head which can be really powerful. You could totally do this on a whiteboard too. I do this constantly and I wanted to share a few examples with you.
The first example here, was when we were walking through how rabbitmq works in episode 59. I just sketched out some ideas for how we highlight that rabbitmq is very much a middle man for your messages.
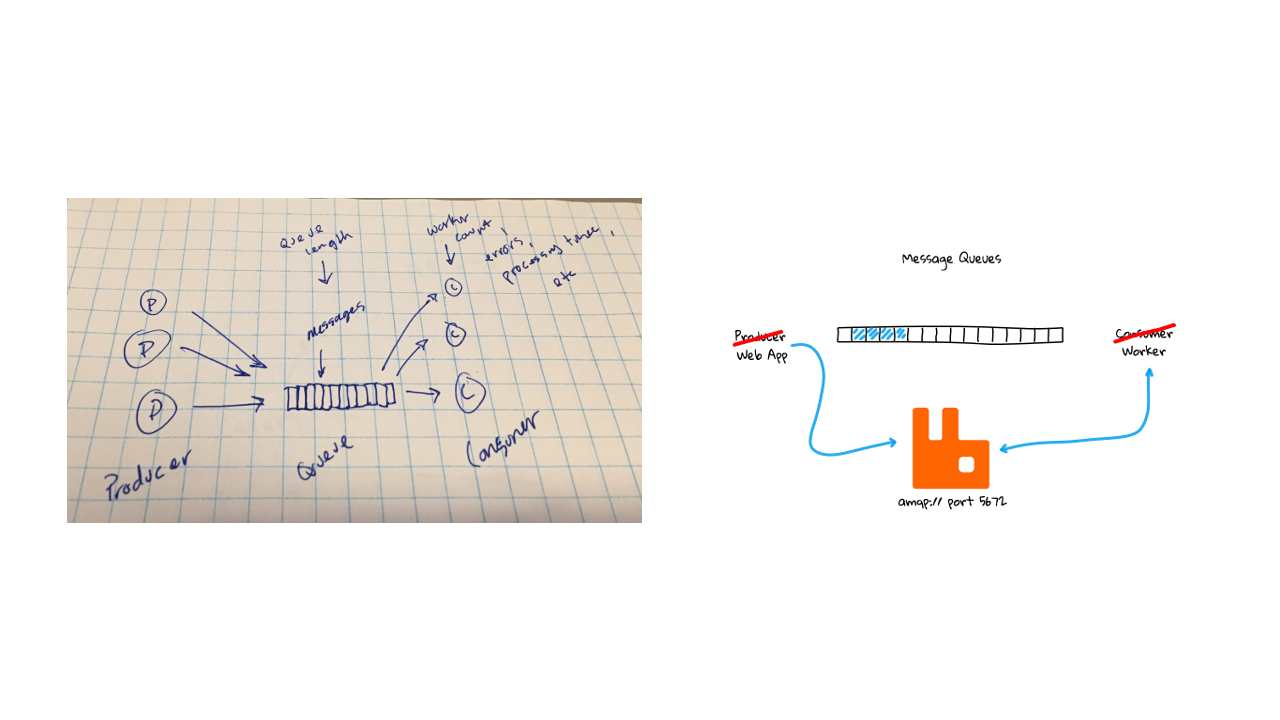
Next, we have the icon for this episode. I just wanted something simple and it was way easier to sketch out a few ideas and then draw it out. You are almost coping what is on the paper into Draw.io which seems simpler almost.
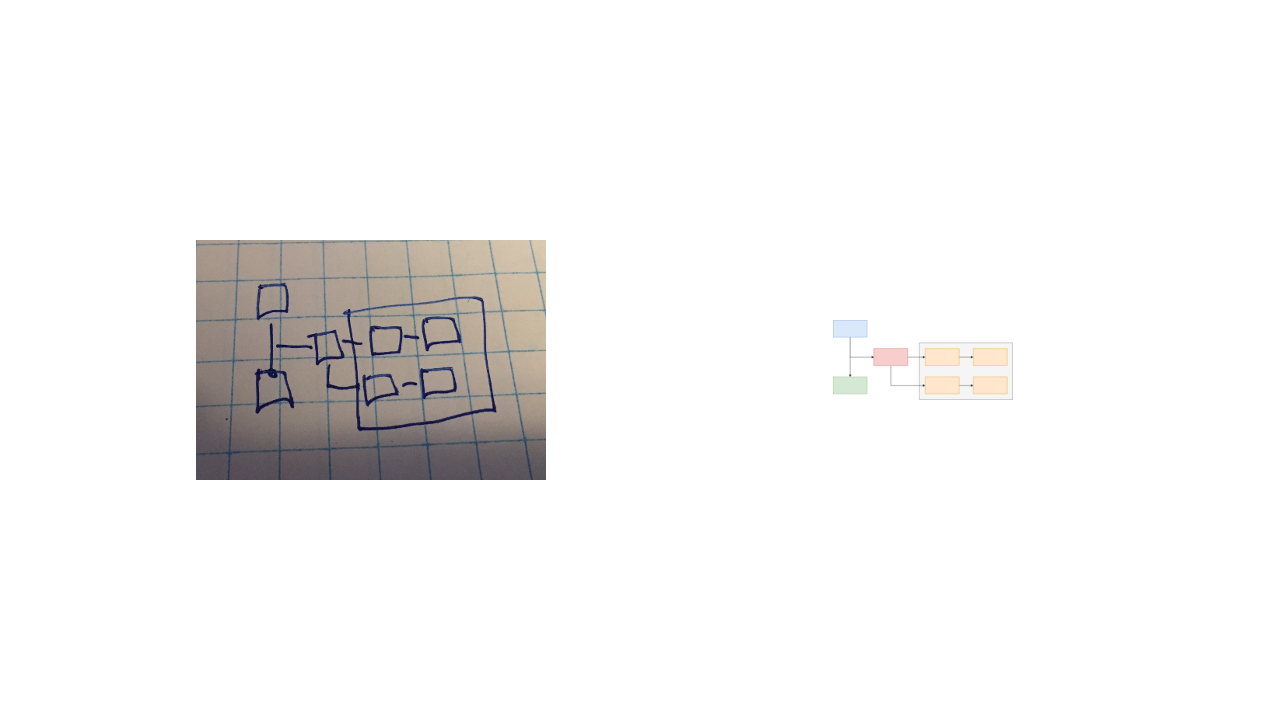
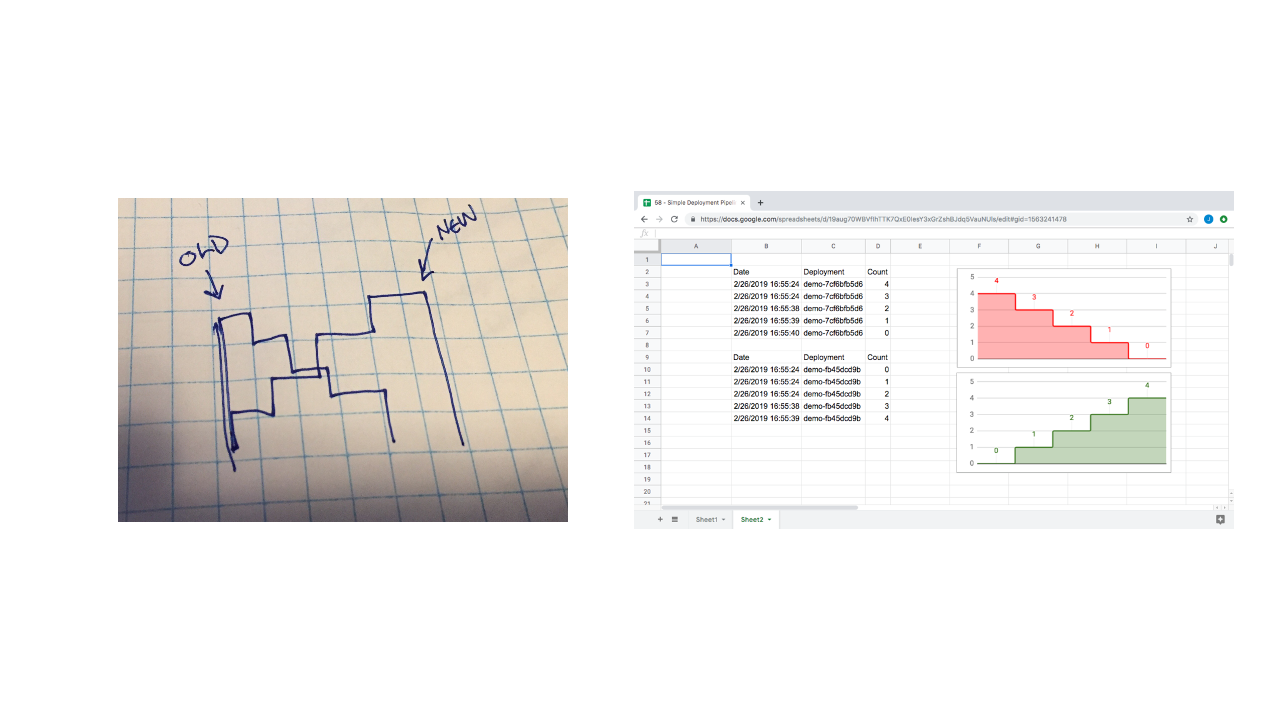
Next, we have the rolling deployment illustration from episode 58. As I was thinking about what I wanted to highlight in that episode, I really wanted to show that there is zero downtime as you have one deployment going down, while the other is coming up. You can see they don’t always look like what was on paper but the idea is there.
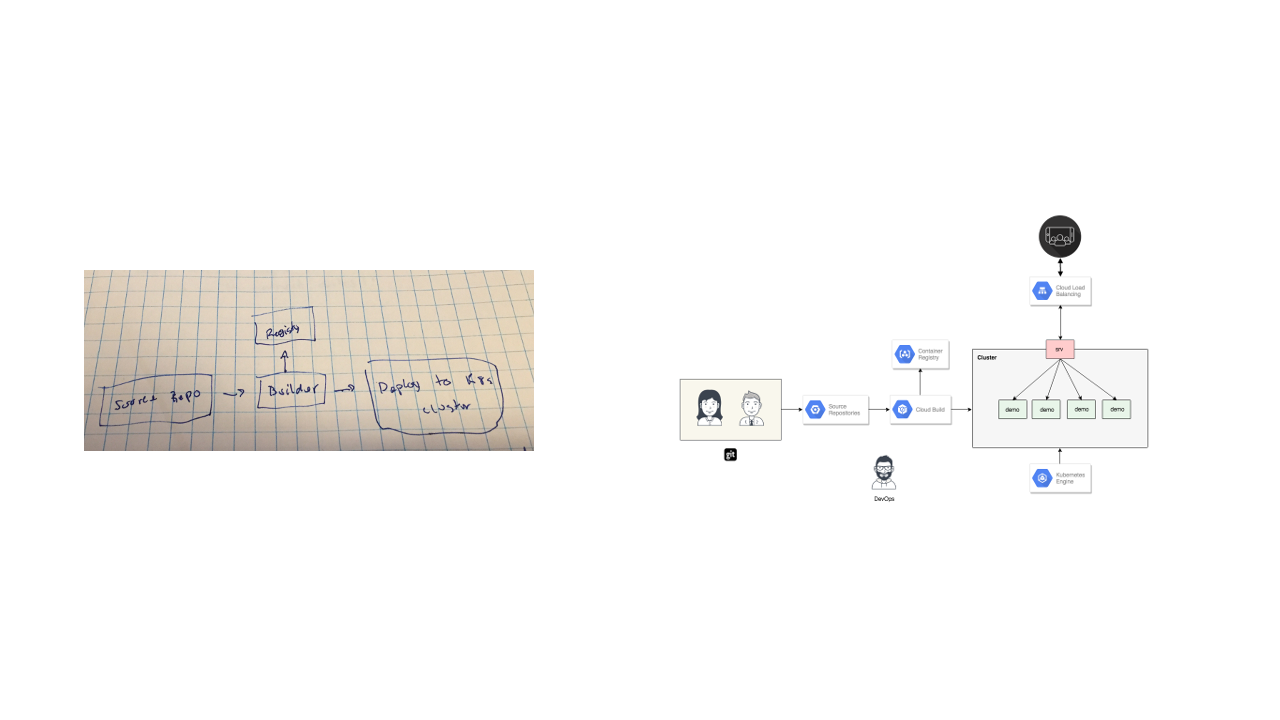
Next, lets take that idea example to the extreme. So, you can see on paper the intent in episode 58 was to show what a simple deployment pipeline looks like. But, often times you need to flush out connected systems to give more context. So, I often find myself adding connected systems when creating an architecture diagrams as it gives the reader more context. They can sort of walk through it and, hopefully go, oh yeah, that is connected to that. I get it.
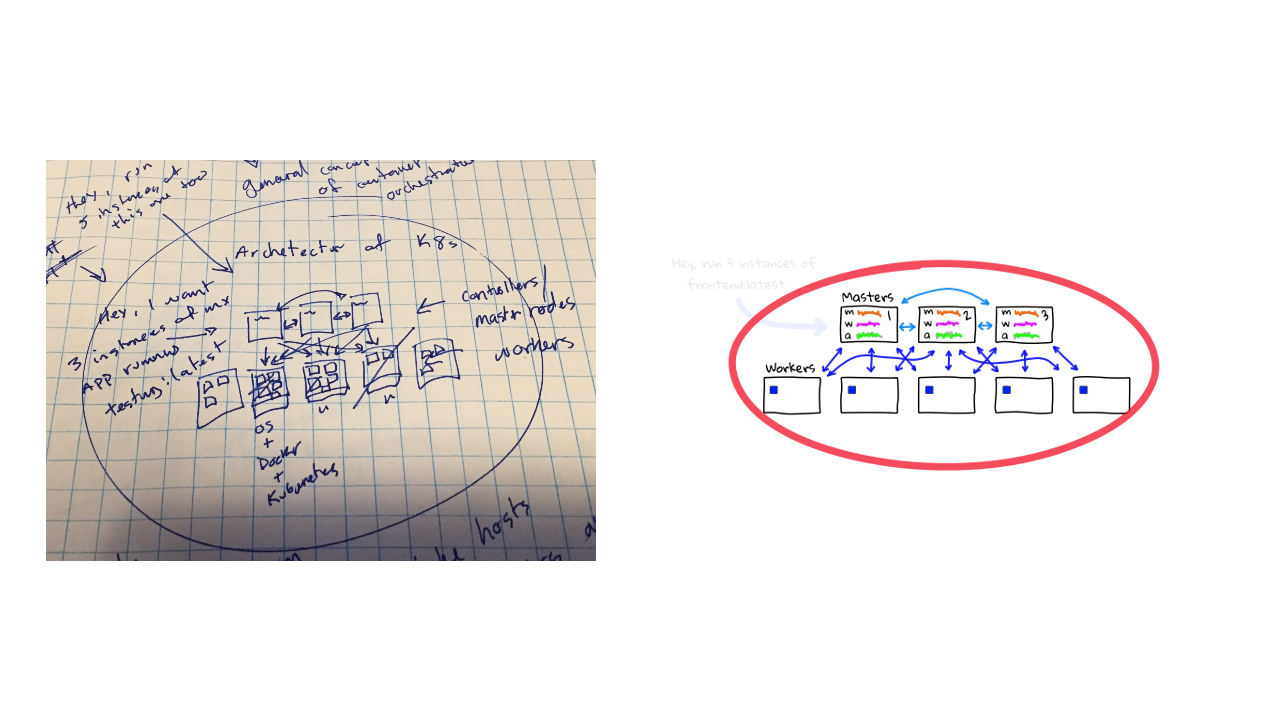
Finally, here is one from episode 56 were we chatted about container orchestration. Even though, this is sort of a stick figure architecture diagram, the intent is still there to drive the point home that these master and slave nodes are the heart of container orchestration.
That is it for the behind the scenes stuff, but I guess the point I wanted to make with all this, is that I would suggest practicing your idea on paper before jumping on the computer. You can flush so much stuff out. I would think about the intent of the image you are creating. What are you trying to tell people. Is there added things you should put on the image to help guide them? I guess this all comes down to planning. But, I would say my time spent are proportional to how important the image is. If this is some quick hack session I might just jot notes down and have a whiteboard session vs creating anything. Again, this is just what works for me.
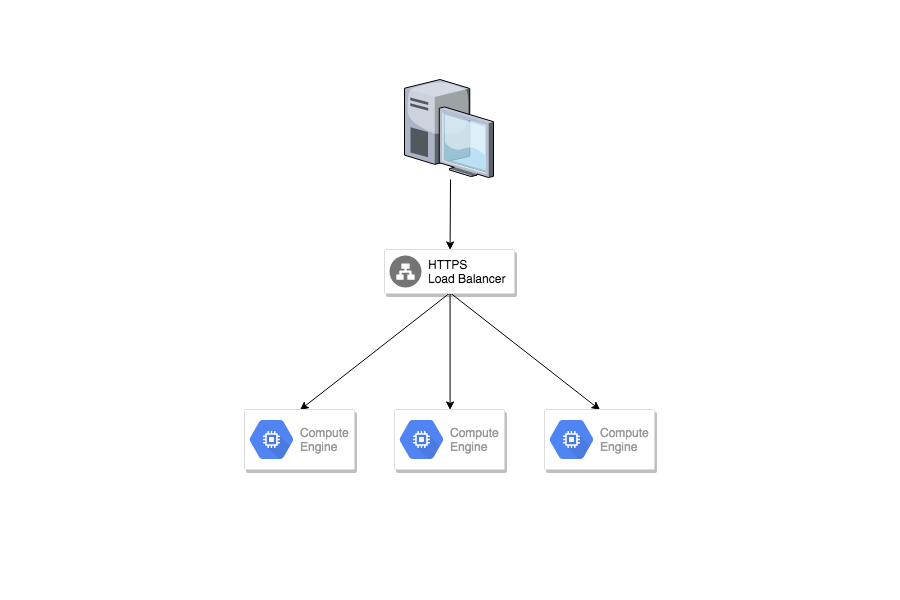
Alright, so lets head back to Draw.io. I wanted to create a super simple 3 node web server architecture where the nodes are accepting traffic through a load balancer. A couple cool things about Draw.io, you can search for icons up here and they already have tons pre-loaded. So, you can see they have a few GCP load balancers here. You just click on them and drag them over. What about AWS. Pretty much anything I have searched for is already here. You can also click this more button here to expand the listing. You can try just AWS too and the listings go on forever. So, I try to narrow things down to product names.
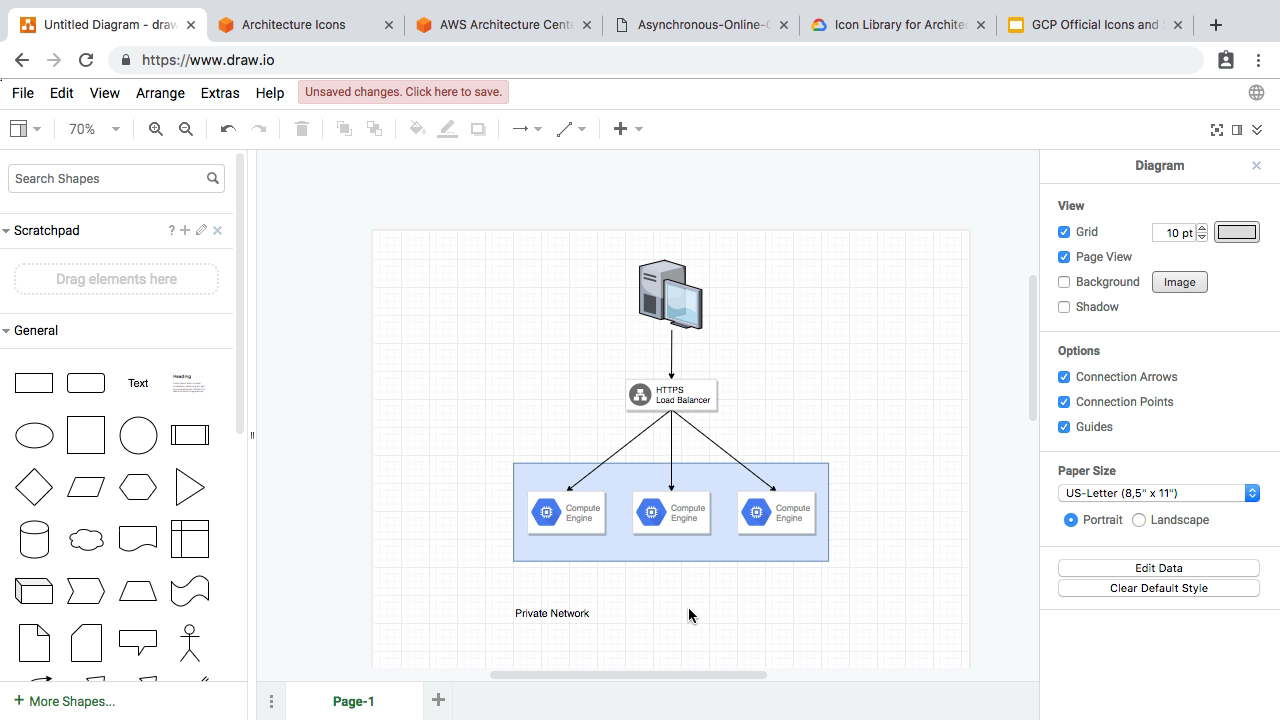
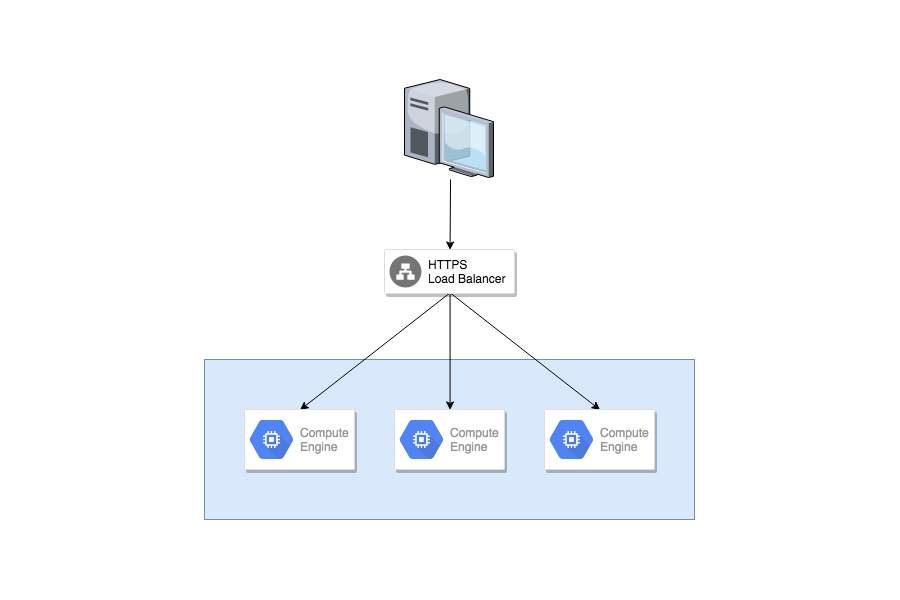
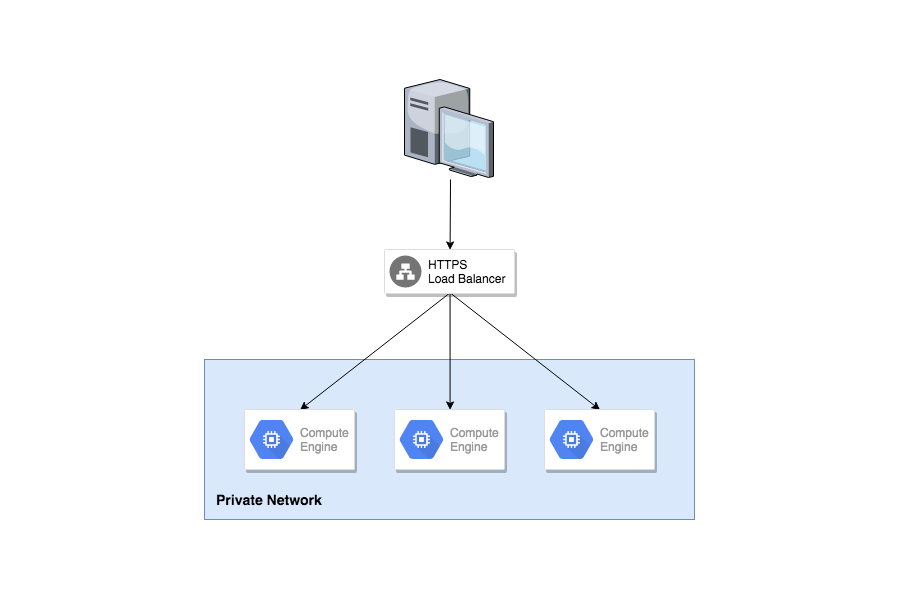
I am just going to speed this next section up as I am sure you have already done something like this. I am just building out 3 node web server architecture. I use the right panel to adjust, the lines sizes, arrow directions, and things like that. Alright, so we have our architecture built out now. For this example, I wanted to call attention to the web server nodes and maybe high-light that they are in a private network. So, I wanted to draw a box around them, and put the box into the background, so it sort of makes the web server nodes stand out. Then, I wanted to add some text that says, private network. Next, let me speed this part up here, I am playing around with the font sizes and box size to see if it makes sense. Just totally what looks visually okay to me.
Alright, lets stop here. Let me just jump into the future here and show you the end result of what we want to create.
So, this is the first image.
Here is the second image.
The third image.
Finally, the forth image.
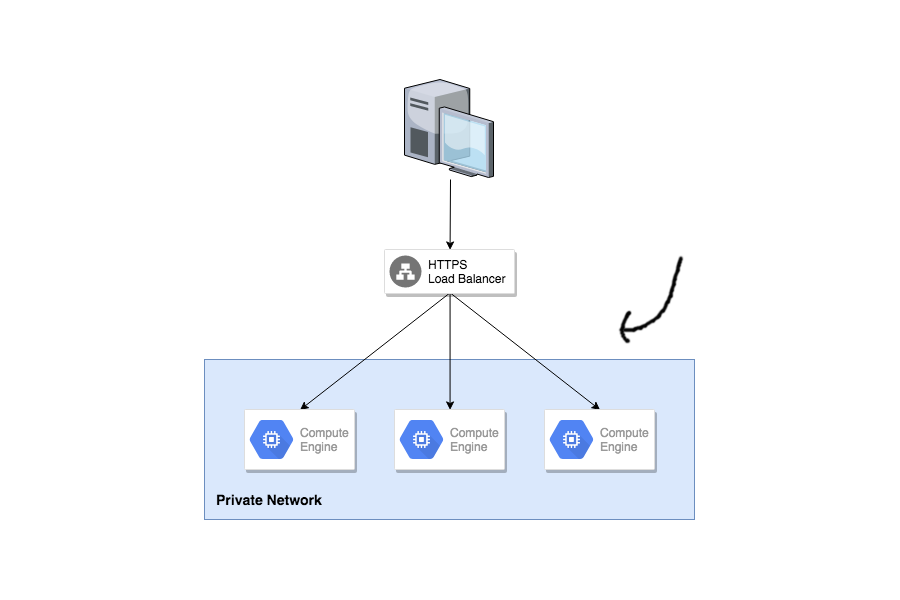
So, with one simple architecture diagram we can create some story around why this private network is important. This would likely work really well for a presentation where you can walk people through it together.
So, lets jump back to Draw.io and see how we create these images. So, what I typically do is create the final architecture diagram and I will go to file, and save that as a PNG graphic, and an XML file. This XML file allows you to reload this architecture diagram into Draw.io and you can pretty much pick up from where you left off. Which is super useful for making tweak to your diagrams. So, that is sort of our end result image. Next, I will think about what I want the second to last image to look like, so I will delete this private network label, then I will save that as an image. Next, I will think about what the next image in the sequence needs to be, so we will delete the box, and save that image. Hopefully, this is making sense. We basically just created these image. But there is a problem here, you can see one of the images is out of alignment and that is because it is typically saved as centered and we are missing a big chunk of that box. We will fix that in a minute. So, you just need to reverse it and now we have something close to the intended result.
Honestly, this is super trial and error as you are working through it step by step to see what you want to do. This is why sketching things down is so much easier. You can think about what you the end result looks like and then build up to it.
Alright, now that we have our images I switch over to using Gimp. It is like the open source version of Photoshop for anyone who hasn’t used it. So, I have Gimp over here and you can see the 3 images we saved on the desktop here. So, I am going to create a new blank image in Gimp for my desired image size. I typically use something like 1280x720 since that works great for HD video. But, you could use whatever works for you. Let me just get this centered here. Oh, actually I need to drag those images over first.
I find it much easier to create these types of animations when you are using layers in Gimp. Basically, you can really easily turn on and off a layer and see what the animation will look like. For some of my episode, there will be like 80 layers. But, it is totally worth it as you can tell a really good story.
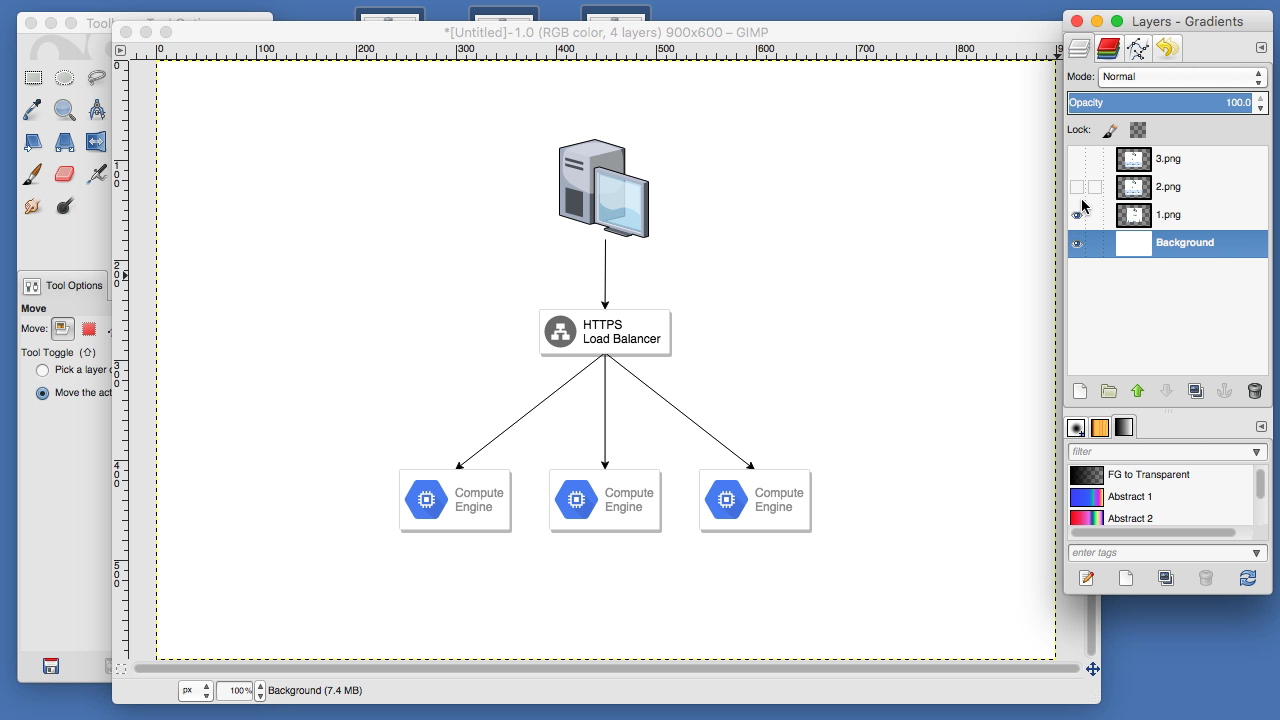
I am just going to speed this next part up here and chat over it. So, the reason I wanted to create that larger image and then drag the layers into it, is that often times you will only be dealing with smaller pieces of a larger image. So, it helps to have a large canvas and then you can position things the way you want. So, what I am doing here is making layers semi-transparent and then I can adjust the image positions to overlap exactly. This can be a little time consuming. Sometimes you need to adjust even more as you can see it is off by a pixel or two here.
Once all that is done. I might add a layer or two for additional arrows. This is a pretty crappy looking arrow but you get the idea. Alright, so we are finally done. We have all the layers now. We can just turn them on and off to get the desired image we need. Let me quickly show you in Gimp. So, we have all our images now and everything is aligned. I am just going to pause the video here and save each of these layers into images called 1, 2, 3, and 4, just because it is pretty boring. Alright, let me start again here. So, we now have 4 images on the desktop and lets load those up into a preview. Lets go full screen here. Now you can just flip through each image and it looks exactly like what you wanted. So, that is the process I use for creating architecture diagrams for documentations and for creating animated architecture diagrams in presentations. This might look like tons of work but it does go quicker after you get used to the workflow.
For a pretty complex example here. Here is the problem solving animation from episode 51. This is 75 images spliced together using this technique. So, this is where I cannot really stress enough that you need to sketch things out as you will save yourself so much time. Another example would be this animation from episode 58. I used Draw.io and the architecture diagram stuff and then used Gimp to import the screenshots and align everything. So, it is pretty versatile but you could literally spend a day or more working on it. So, don’t spend a day when you could easily get the same point across with a 15 drawing on a whiteboard. Chances are you are not going to go too crazy with this, but you can create some cool effect with just 2-3 images, and make things pop.
Alright, so I have also put together a little architecture diagram template that you might find useful. This type of thing has served me well when I need to write some technical documentation for work. I will start off with some type of project description, with maybe your name and the date (if people want to contact you), and then a high-level overview of the thing you are chatting about. Next, maybe a high-level architecture diagram.
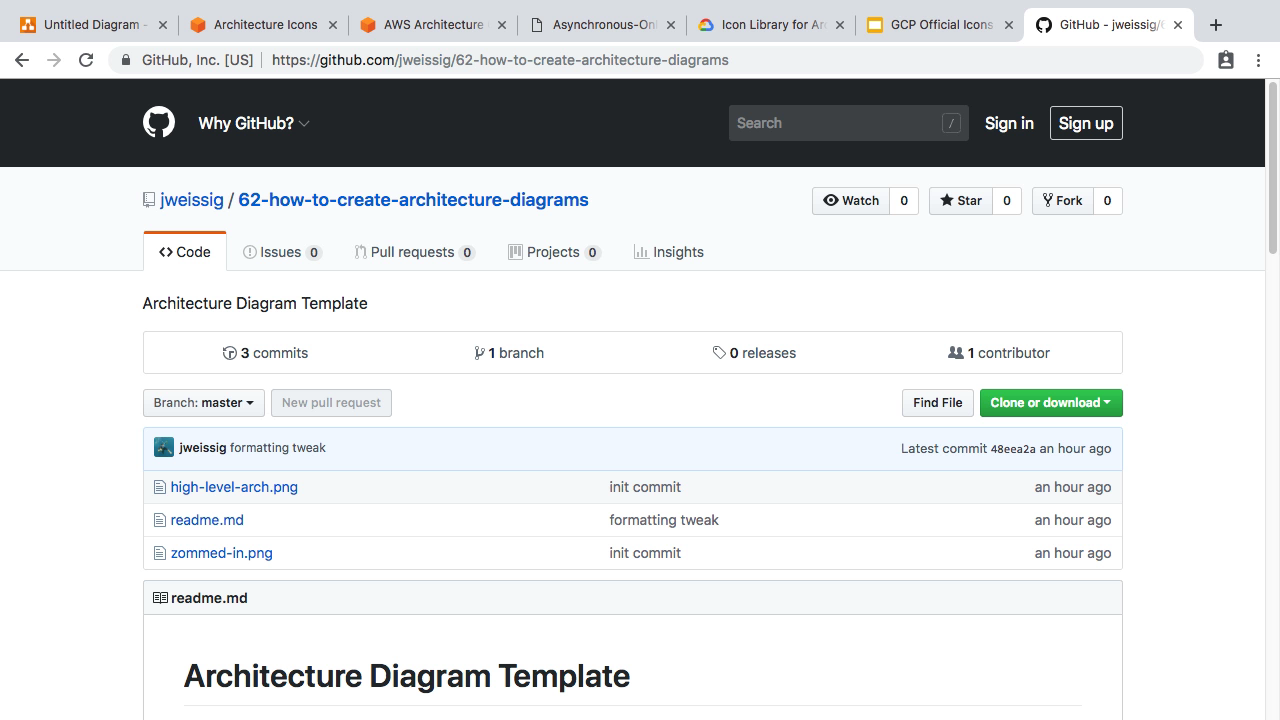
Next, maybe a section about the infrastructure involved in this project. Things like where it is, what is it, how you build it, etc. Are you using config management. Container Orchestration. Terraform, etc. Lots of things you could put in here.
Next, maybe a section on the application side of things. Things like where it is, what is it, how you build it, commands needed. Where does the code live? Where does the data live? Maybe some zoomed in shots from that higher level architecture diagram.
Finally, maybe close things off with a troubleshooting section. This can be a place to check for getting a sense for how monitoring is configured, maybe useful commands for debugging, etc.
Chances are your company already have something like this via a runbook or something. But, if you have nothing, this might be a good starting point. These types of documents and diagrams are great when new people join your team. Or, just helpful as a refresher to get folks on the same page. Infrastructure diagrams are also super useful when you need to scale things as you can sort of visually walk a request through the diagram and think about what will break.
Anyways, hopefully you will find something in here useful. That is it for this episode. Thanks for watching and I will see you next week. Bye.