- Wikipedia: cgroups
- kernel.org: cgroups.txt
- kernel.org: cgroups folder
- kernel.org: blkio-controller.txt
- kernel.org: memory.txt
- Red Hat: Introduction to Control Groups (Cgroups)
In this episode we are going to review Control Groups (cgroups), which provide a mechanism for easily managing and monitoring system resources, by partitioning things like cpu time, system memory, disk and network bandwidth, into groups, then assigning tasks to those groups.
Let me try and explain what control groups are, and what they allow you to do. Lets say for example that you have a resources intensive application on a server. Linux is great at sharing resources between all of the processes on a system, but in some cases, you want to allocate, or guarantee, a greater amount to a specific application, or a set of applications, this is where control groups are useful.
For example, lets say we wanted to assign or isolate an applications resources, lets create two groups, group #1 will be for our operating system, and group #2 will be for our application, then we can assign resource profiles to each group.
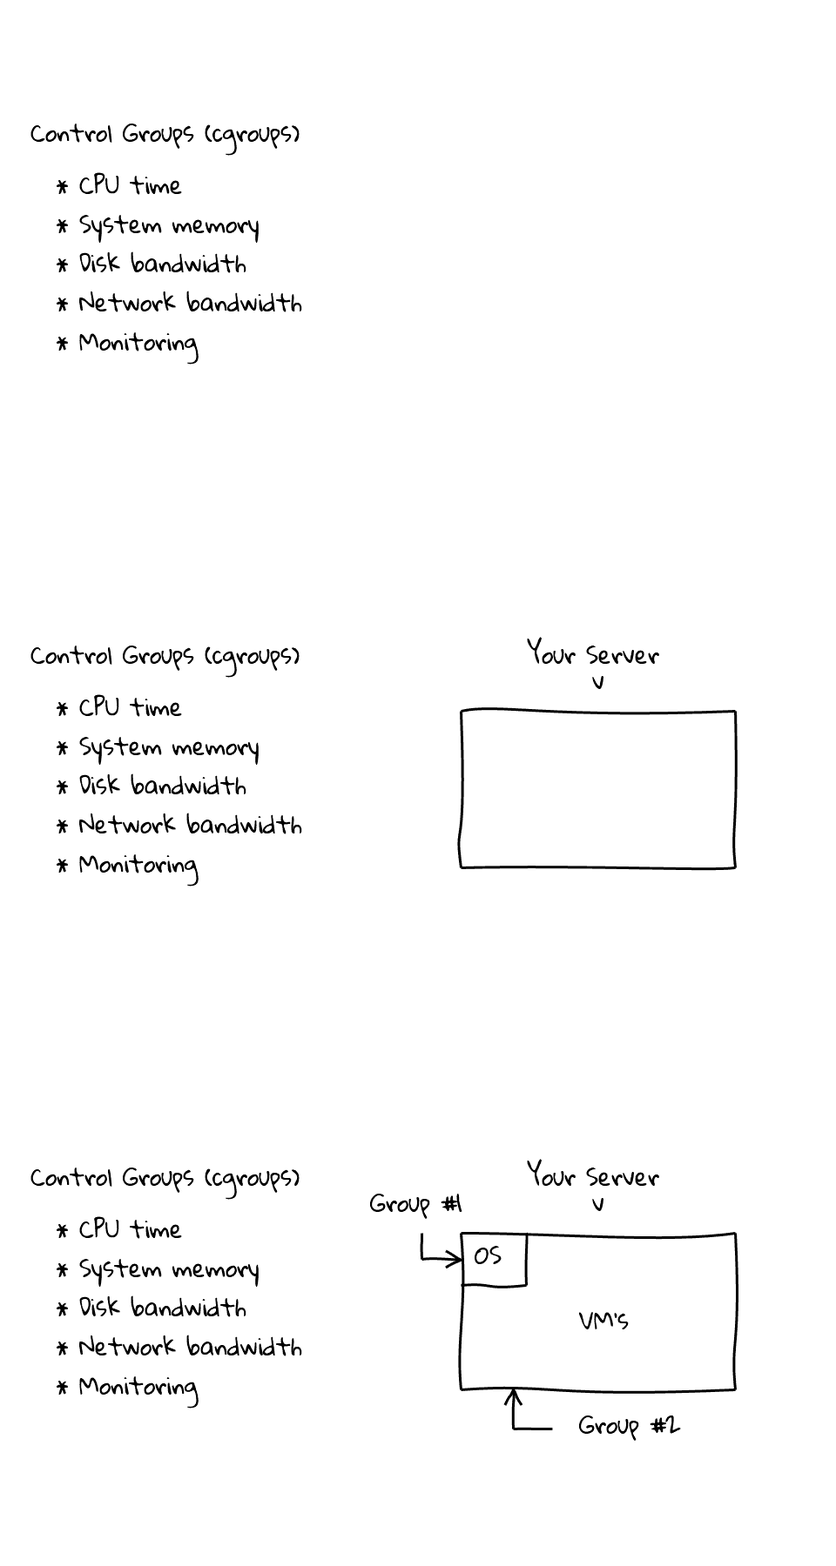
Lets focus on Group #2 for a moment. Typically when you create a group, you already have a problem in mind, so for the sake of this example, lets say we wanted to manage, cpu, memory, disk and network bandwidth, for our application. So, I would create a group, and assign resources limits to this group, something like this. Keep in mind, the application knows nothing about these limits, this is happening outside of our application. So, any application that is assigned to this group, cannot use more than 80% of the cpu, 10 GB of memory, 80% of disk reads and writes, and finally, 80% of our network bandwidth. Once the group is created, you simple need to add your applications process ids, or pids, into a file, and your applications are automatically throttled. This can happen on the fly, without system reboots, you can also adjust these limits on the fly. I just wanted to mention, that our application will be allowed to spike outside these percentage limits, but if there is resource contention, our application will be throttled back to 80%.

Monitoring is also baked in from the start, so we can monitor resource consumption for any application that is assigned to this group, things like, cpu cycles used, the memory profile, IOPS and bytes written and read from our disks, along with network bandwidth used.
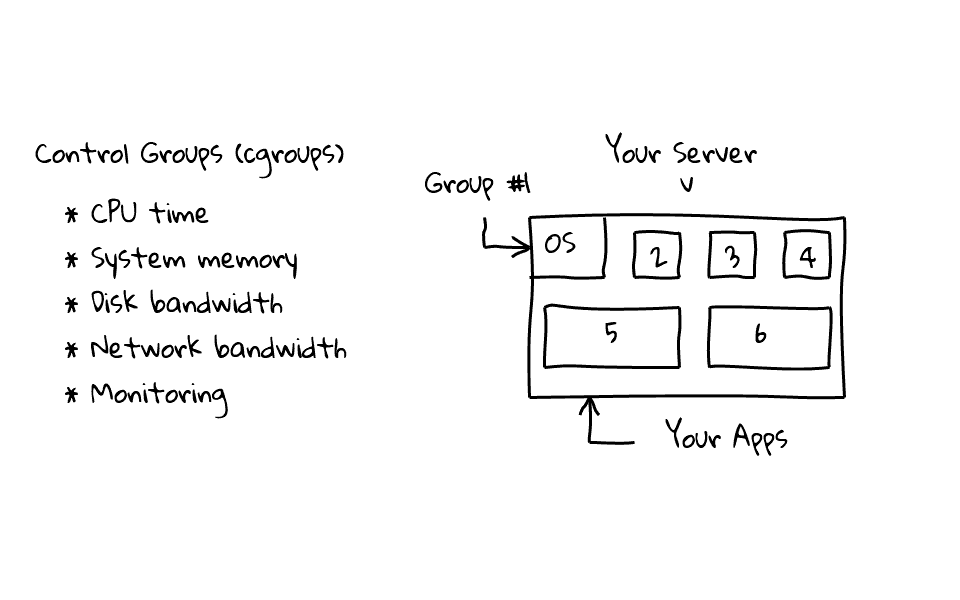
Lets jump back for a moment, and use a different example, lets say we have an environment, where we are hosting virtual machines, instead of just having two groups, one for our operating system, and one for our application, we can have many groups, one assigned to each virtual machine. For example, lets say we are worried about a virtual machine saturating the network link or disk IOPS, we can limit the impact by using control groups, which can be really handy.
There is plenty of documentation out there. The Wikipedia page gives a pretty good overview. If you are interested in a little bit of history, work was started on control groups by two engineers at Google, in 2006 under the name “process containers”, but in 2007, it was merged into the Linux kernel and renamed “control groups”.
The kernel docs are amazing and should be considered the definitive source. I will reference them in the upcoming example. Redhat also has a great chapter in their manual about control groups. I have linked to all of these sites in the episode notes below.
Alright, lets move on to the examples. Lets go ahead and install libcgroup on a CentOS 6.4 machine, by running, yum install libcgroup. I always like to see what files were just installed, this helps me know where to look for scripts and configuration files. Lets run rpm –query –list libcgroup and pipe the output to less, which will give us a listing of all the files and their locations for the libcgroup package we just installed.
yum install libcgroup
rpm --query --list libcgroup | less
ls -l /cgroup
So, libcgroup places a bunch of utilities in /bin, creates a /cgroup directory, where we can mount the various subsystems, then there are several configuration files and init scripts in /etc, followed by a couple more utilities in /sbin, and it looks like the rest is just documentation and man pages.
Okay, so we noticed that a new /cgroup directory was created, this is where the cgroup virtual filesystems will be mounted. There is nothing in there now, but before we populate it, lets review the /etc/cgconfig.conf file, to see what mounts we can expect. You will notice here, that it says, by default, mount all cgroup controllers to /cgroup/ followed by the controller name, then down here you will see that they are all defined.
less /etc/cgconfig.conf
Okay, so now that we know what to expect, lets go ahead and mount the control groups, we do this by running, service cgconfig start, then lets ls /cgroup again, and you will notice that we have several directories in here now. Each one of these directories can be used to manage a control group subsystem, for example, the blkio directory can be used to manage block devices, or these cpu directories, to manage cpu resources. Lets go ahead and list the contents of the blkio directory, were we can review what the structure looks like, and talk about some common files that you will likely interact with.
service cgconfig start
ls -l /cgroup
First, you will notice that most of these files are prefixed with the controller name, in this instance, blkio, this is useful because when you combine multiple control groups, say for example blkio and the memory controllers, there will be no name conflicts, and it is clear what subsystem you are interacting with.
Next, each root control group will always have these five files, first we have the tasks file, this file contains a list of process ids, or pids, attached to this control group. So, if you want to assign any given process on a system to this control group, you just need to echo its process id, or pid, into this tasks file, simple as that. Next there is the cgroup.procs, this is similar to the tasks file, but this one contains the thread group ids, which can be useful if you have multithreaded applications. Next there is cgroup.event_control, this can be used to hook in a notification API of some type, say for example that you wanted to be notified when a process hits an out of memory condition or something similar.
These next two, notify_on_release and release_agent work hand in hand. These can be useful for taking action when all processes in a control group terminate. This works by setting notify_on_release to either true or false, true being that you want to take action, and false that is does nothing, the default value is false. So you would point release_agent at a script of your choosing, and when the last process terminates in this control group, if notify_on_release is set to true, it will execute that script. This can be really useful for logging or getting notifications.
Now that we know a little about the control group structure, lets create a new child group within the blkio control group. So, we are in the /cgroup/blkio directory, and we want to create a new child group called test1, within the blkio control group, we just create a directory called test1, you can also use the cgcreate command, but just creating a new directory is pretty self explanatory. Lets list the directory contents again, as you can see our new directory is here. Lets change to this test1 directory and list the contents. So, you can see that our directory get automagically populated, and that it looks exactly like the parent directory, with the exception of the release_agent file. The release_agent is only present at the topmost of root level object. Just to show you the hierarchy again, we have the /cgroup directory, then the blkio subsystem, and then as a child of blkio, we have a group called test1. You can also use the lscgroup utility to display control groups, so you can see we have the blkio group, and we also have the blkio:/test1 group. We will be using this notation in several upcoming examples.
mkdir /cgroup/blkio/test1
cd /cgroup/blkio/test1
lscgroup
I think this plays well into our first example, lets assume you want to throttle the read or write rate of a particular process or group of processes. Lets configure our newly create blkio test1 group to do just that.
Before we being, let me explain how we are going to run this demo, in the topmost window here, I am going to run iotop, this will give us a status of anything reading or write to our disks, along with the rate. Then in the bottom terminal window, I am going to create a couple 3GB files, we are going to compare disk read rates for processes that are part of our control group, to ones without a control group.
iotop
I am going to run dd, we are going to use /dev/zero as the input file, output to file-abc, byte count is 1Meg, and we will do this 3000 times, giving us a 3GB file of zeros. You can see, up in the top window here, iotop is reporting that we are writing around 500Megs a second, then down here, dd has finished writing the file. I am just going to create a second file called file-xyz, so that we can compare files in a control group to ones outside it. Again, iotop is reporting the disk write, and dd completes a short time later. I will just list the files and verify their size, so that we know what we are working with.
dd if=/dev/zero of=file-abc bs=1M count=3000
dd if=/dev/zero of=file-xyz bs=1M count=3000
Before we go any further, lets just make sure we flush any filesystem buffers to disk, by running sync. Then, lets run free -m, to show our memory usage, notice the memory used, and cached columns. Lets dump the cache, since it likely contains bits of our files, which might improve any performance measurements we take. Lets drop the cache by running echo 3 > /proc/sys/vm/drop_caches, then lets run free -m again, notice how the memory used, and cached columns both then down.
free -m
echo 3 > /proc/sys/vm/drop_caches
free -m
Lets take a quick peek at the blkio controller documentation, so that I can explain what we are about to do. Under the throttling section, there are a couple files that we can use to throttle read and write rates for block devices, along with the expected syntax.
By the way, you can find this document, along with all cgroup documentation, at the kernel.org site, I have provided a link in the episode notes below.
Lets focus on throttling the read rate, so we echo, the devices major and minor values, which we want to rate little, or throttle, along with the rate in bytes per second to this file.
So, we still have iotop running in the topmost window, then in down here, lets list the control groups again, by running lscgroup. So we have the blkio controller, and the blkio test1 group under that. Lets go ahead and change into that test1 directory. We need to echo the devices major and minor number, along with the rate in bytes per second, into this blkio.throttle.bytes_per_second file, but where do we get these major and minor numbers from? It is actually pretty easy, the machine I am working on, only has one disk, and that is /dev/sda, lets just list the /dev/sda* entries. So you can see in the output here, that we have these number, for /dev/sda they are 8 and 0, these are the major and minor number we are looking for. Since the files I want to rate limit are stored on /dev/sda, we will use these.
lscgroup
ls -l /dev/sda*
Alright, lets type our command using the syntax we learned from the documentation, echo “8:0 5242880” > blkio.throttle.read_bps_device, so we said, echo, device 8:0, that is /dev/sda, 5MB in bytes per second, and output that to blkio.throttle.read_bps_device. Lets just cat that file to verify our values stuck.
echo "8:0 5242880" > blkio.throttle.read_bps_device
Before we test this rate limit, lets get a baseline for what performance is like without it. Let use the dd command to read file-abc from disk and write it to /dev/null. We can watch iotop in the top panel to get an idea of how fast it is going. So, you can see it is being read from disk at 350+MB/s. So, lets drop the disk cache again, and verify it with the free -m command.
echo 3 > /proc/sys/vm/drop_caches
free -m
We can use the cgexec command to run commands in a control group. So, we are going to run the dd command again, which just was reading from disk in excess of 350+MB/s and apply it to our blkio:test1 control group, which is throttled to 5MB/s.
Lets run, cgexec -g blkio:test1 dd if=file-abc of=/dev/null, so this says, control group execute, use the blkio:test1 group, you can get this notation from the lscgroup command, and run our dd command, using our input file-abc and output that to /dev/null.
cgexec -g blkio:test1 dd if=file-abc of=/dev/null
You can see up in the topmost window, that iotop is reporting that this is reading at a rate of 5MB/s. Looks like its working. What is great about this, is that you can take any application, which does not have any build in rate limiting, and throttle it back as needed! I am just going to cancel this, as it will take a long time to complete, as you can see 5.2MB/s with throttling vs 372MB/s without.
In the interest of saving time, I ran several tests and plotted the output using gnuplot. Lets take a look at the output. So we have two different files here, one represented in red, and the other in blue. The y axis is MB/s, and the x axis is time in seconds.
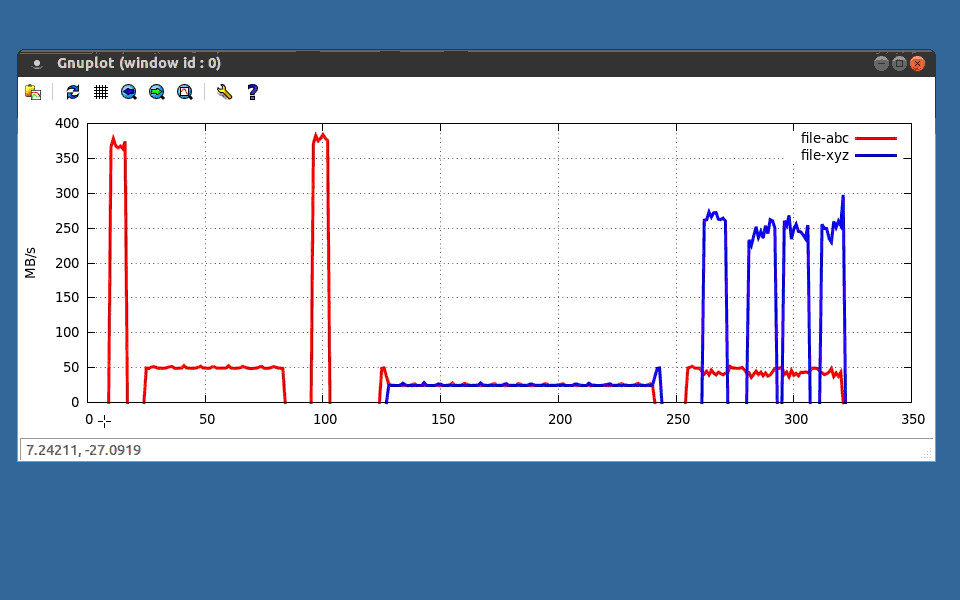
These first three data points are the result, of running dd without the rate limit, with the rate limit, and then without is again. We are hitting 350+MB/s, in the first instance, then down to 50MB/s, then back up with 350+MB/s again. By the way, I changed the rate limit from 5MB/s to 50MB/s, just to make the plots look at little nicer. Lets zoom in on this second hump here, as you can see it nicely follows our 50MB/s limit.
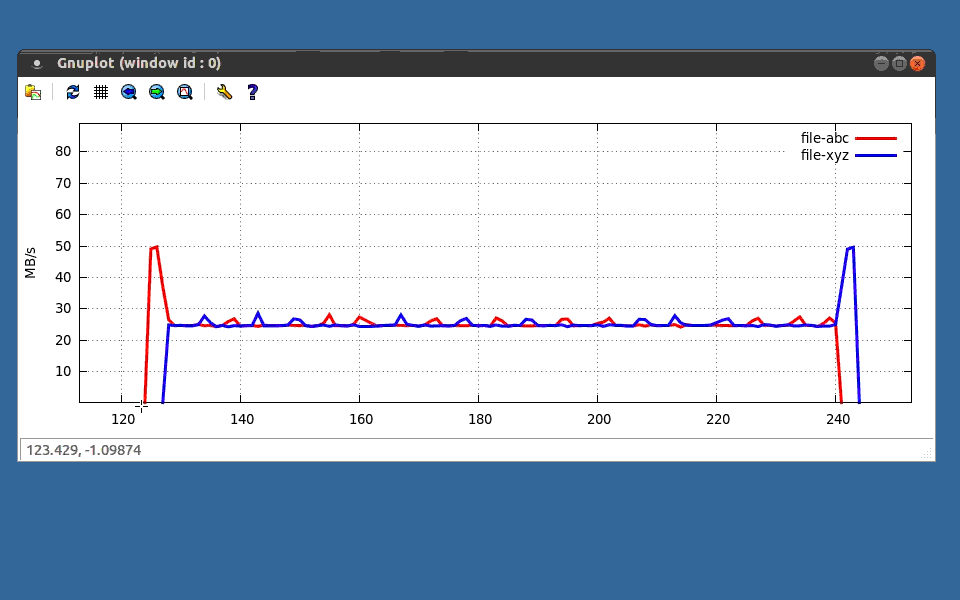
This next chunk of data is interesting, I read two files from disk at the same time, using the same control group. Lets zoom in and take a look. You can see that when the first read process starts, it quickly shot up to the 50MB/s limit, but a couple seconds later, I started the second process, indicated in blue, and then something interesting happens, both processes read from disk at around 25MB/s, for a total of our 50MB/s limit, then the red process terminates, and the blue one briefly hits the 50MB/s limit, and also terminates. Pretty cool to see this in action!
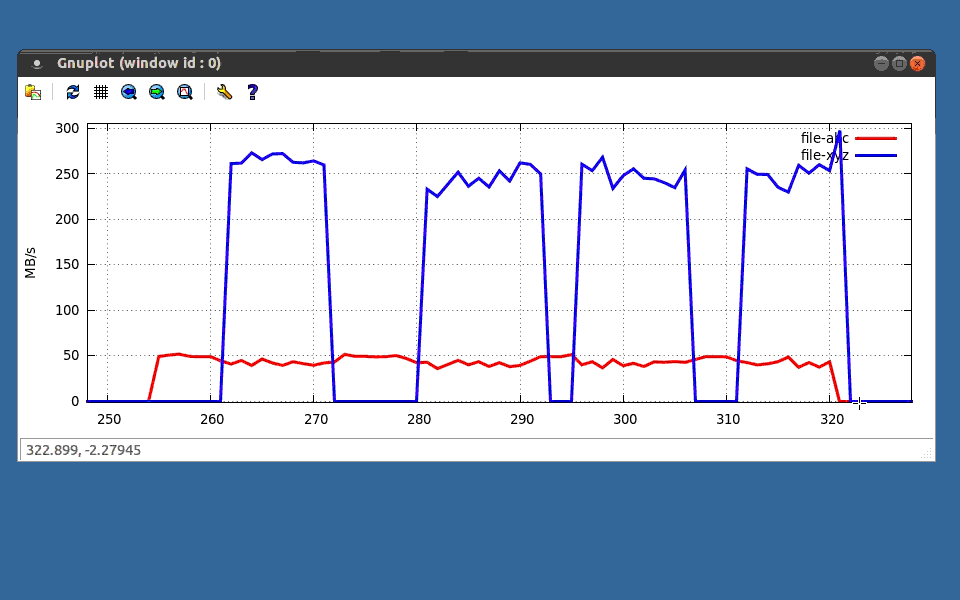
Then in this last example, I ran a process in the control group, indicated in red, and then several instances in blue without it, just to compare performance, and to illustrate that you can do both at the same time.
We have probably talked about this enough, lets move on to another example, using a different controller, this time lets look at the memory subsystem. In this example we are going to look at a way to limit the amount of memory a process can use. Before we do this, let me show you the program we are going to test with, I create an example program in c, called mem-limit. Lets take a quick look at it, and I will explain what it does.
cat mem-limit.c
#include <stdio.h>
#include <stdlib.h>
#include <string.h>

int main(void) {

    int i;
    char *p;

    // intro message
    printf("Starting ...\n");

    // loop 50 times, try and consume 50 MB of memory
    for (i = 0; i < 50; ++i) {

        // failure to allocate memory?
        if ((p = malloc(1<<20)) == NULL) {
            printf("Malloc failed at %d MB\n", i);
            return 0;
        }

        // take memory and tell user where we are at
        memset(p, 0, (1<<20));
        printf("Allocated %d to %d MB\n", i, i+1);

    }

    // exit message and return
    printf("Done!\n");
    return 0;

}
The heart of the app is a for loop, that at each iteration will try and grab 1 megabyte of memory, for a maximum of 50 times, and it will print updates along the way. Okay, lets compile, and run it, without an restrictions to see what it will look like.
gcc mem-limit.c -o mem-limit
./mem-limit
Lets scroll up, you will see that it says it is starting, and then starts allocating memory, printing updates as it goes, all the way to 50 megabytes and then, prints done!
Lets go into the /cgroup/memory directory, in here we are going to create a subgroup called test2. Then lets change into that directory. We can list the contents, hopefully the structure looks a little familiar now. You can also run the lscgroup command, and our new group appears in addition to the one we created earlier.
mkdir /cgroup/memory/test2
cd /cgroup/memory/test2
lscgroup
Before we go any further, lets take a look at the documentation for the memory subsystem. Similar to how we looked at the blkio controllers earlier.
We are going to use these two files, under the memory controller, in this example, memory.limit_in_bytes, and memory.memsw.limit_in_bytes, these basically allow us to set the limit for physical memory and swap usage. So we just need to echo our limits into these files. By the way, I found this file, in the same directory as the blkio document, it is linked to in the episode notes below.
Okay, lets configure our memory limits, lets echo 5242880 to memory.limit_in_bytes, we also need to echo this value into memory.memsw.limit_in_bytes, this will restrict swap access. If we do not do this, it will hit the 5MB limit for physical memory, and our program will start eating up swap, so we want this to hit a hard limit.
echo 5242880 > /cgroup/memory/test1/memory.limit_in_bytes
echo 5242880 > /cgroup/memory/test1/memory.memsw.limit_in_bytes
Lets test this out using out mem-limit script we looked at earlier. We are going to use the cgexec command again, but this time using the memory:test2 group, so lets run, cgexec -g memory:test2 ./mem-limit, and boom, we hit the limit, and the process was killed at the 5MB limit. Lets take a look at the last couple lines of dmesg, where there are a couple kernel messages about our process being killed, for example, group out of memory, killed, the process number, and the process name. Pretty cool!
cgexec -g memory:test2 ./mem-limit
Before I wrap up this episode, I wanted to show you how to dump the running control group configuration. At the very beginning of the episode, we looked at the /etc/cgroup.conf file, which we used to mount the cgroup virtual filesystem on /cgroup.
You can use the cgsnapshot command, to dump the running configuration, lets look at the output. So, you can see we have our mounts, then our test2 group, along with our memory values, then down here we have our test1 group, along with device rate limit. For example, you could do something, like redirect the output of cgsnapshot to /etc/cgconfig.conf to have these setting reappear at the next reboot.
And last but not least, we already covered the cgconfig service, but what about this cgred service? Cgred can be used to classify programs in the background, and assign them to control groups. In the examples that we covered today, we manually ran programs in a control group via the cgexec command, but with cgred, you can define rules, and automatically, slot processes into these groups. You can do this by using the /etc/cgrules.conf file, to classify users, commands, or even entire user groups into predefined control groups based off defined rules. This is extremely useful, since up till now we have been manually assigning tasks into control groups.
less /etc/cgrules.conf
We barely scratched the surface of what control groups can be used for, you can do similar things for cpu and network resources, never mind all the accounting and monitoring information, that you can collect. If you have the need to manage resources on a machine, be it for process segregation, managing virtual machine, or Linux containers, you should really look into using control groups.